


Geneva, Switzerland-based eye care product seller Alcon Inc. (ALC) reported its third-quarter financials yesterday. The company’s net sales rose 8.4% year-over-year to $2.30 billion but missed analysts' average forecast of $2.35 billion.
Its core net income of $327 million also missed the estimated $329.59 million. ALC tightened its fiscal 2023 net sales outlook from $9.3 billion-$9.5 billion to $9.3 billion-$9.4 billion and its core EPS outlook from $2.70-$2.80 to $2.70-$2.75.
Given this lighter-than-expected earnings report, let’s look at the trends of ALC’s key financial metrics to understand why it could be wise to watch and wait for a better entry point in the stock.
Analyzing ALC's Financial Performance (2020 - 2023)
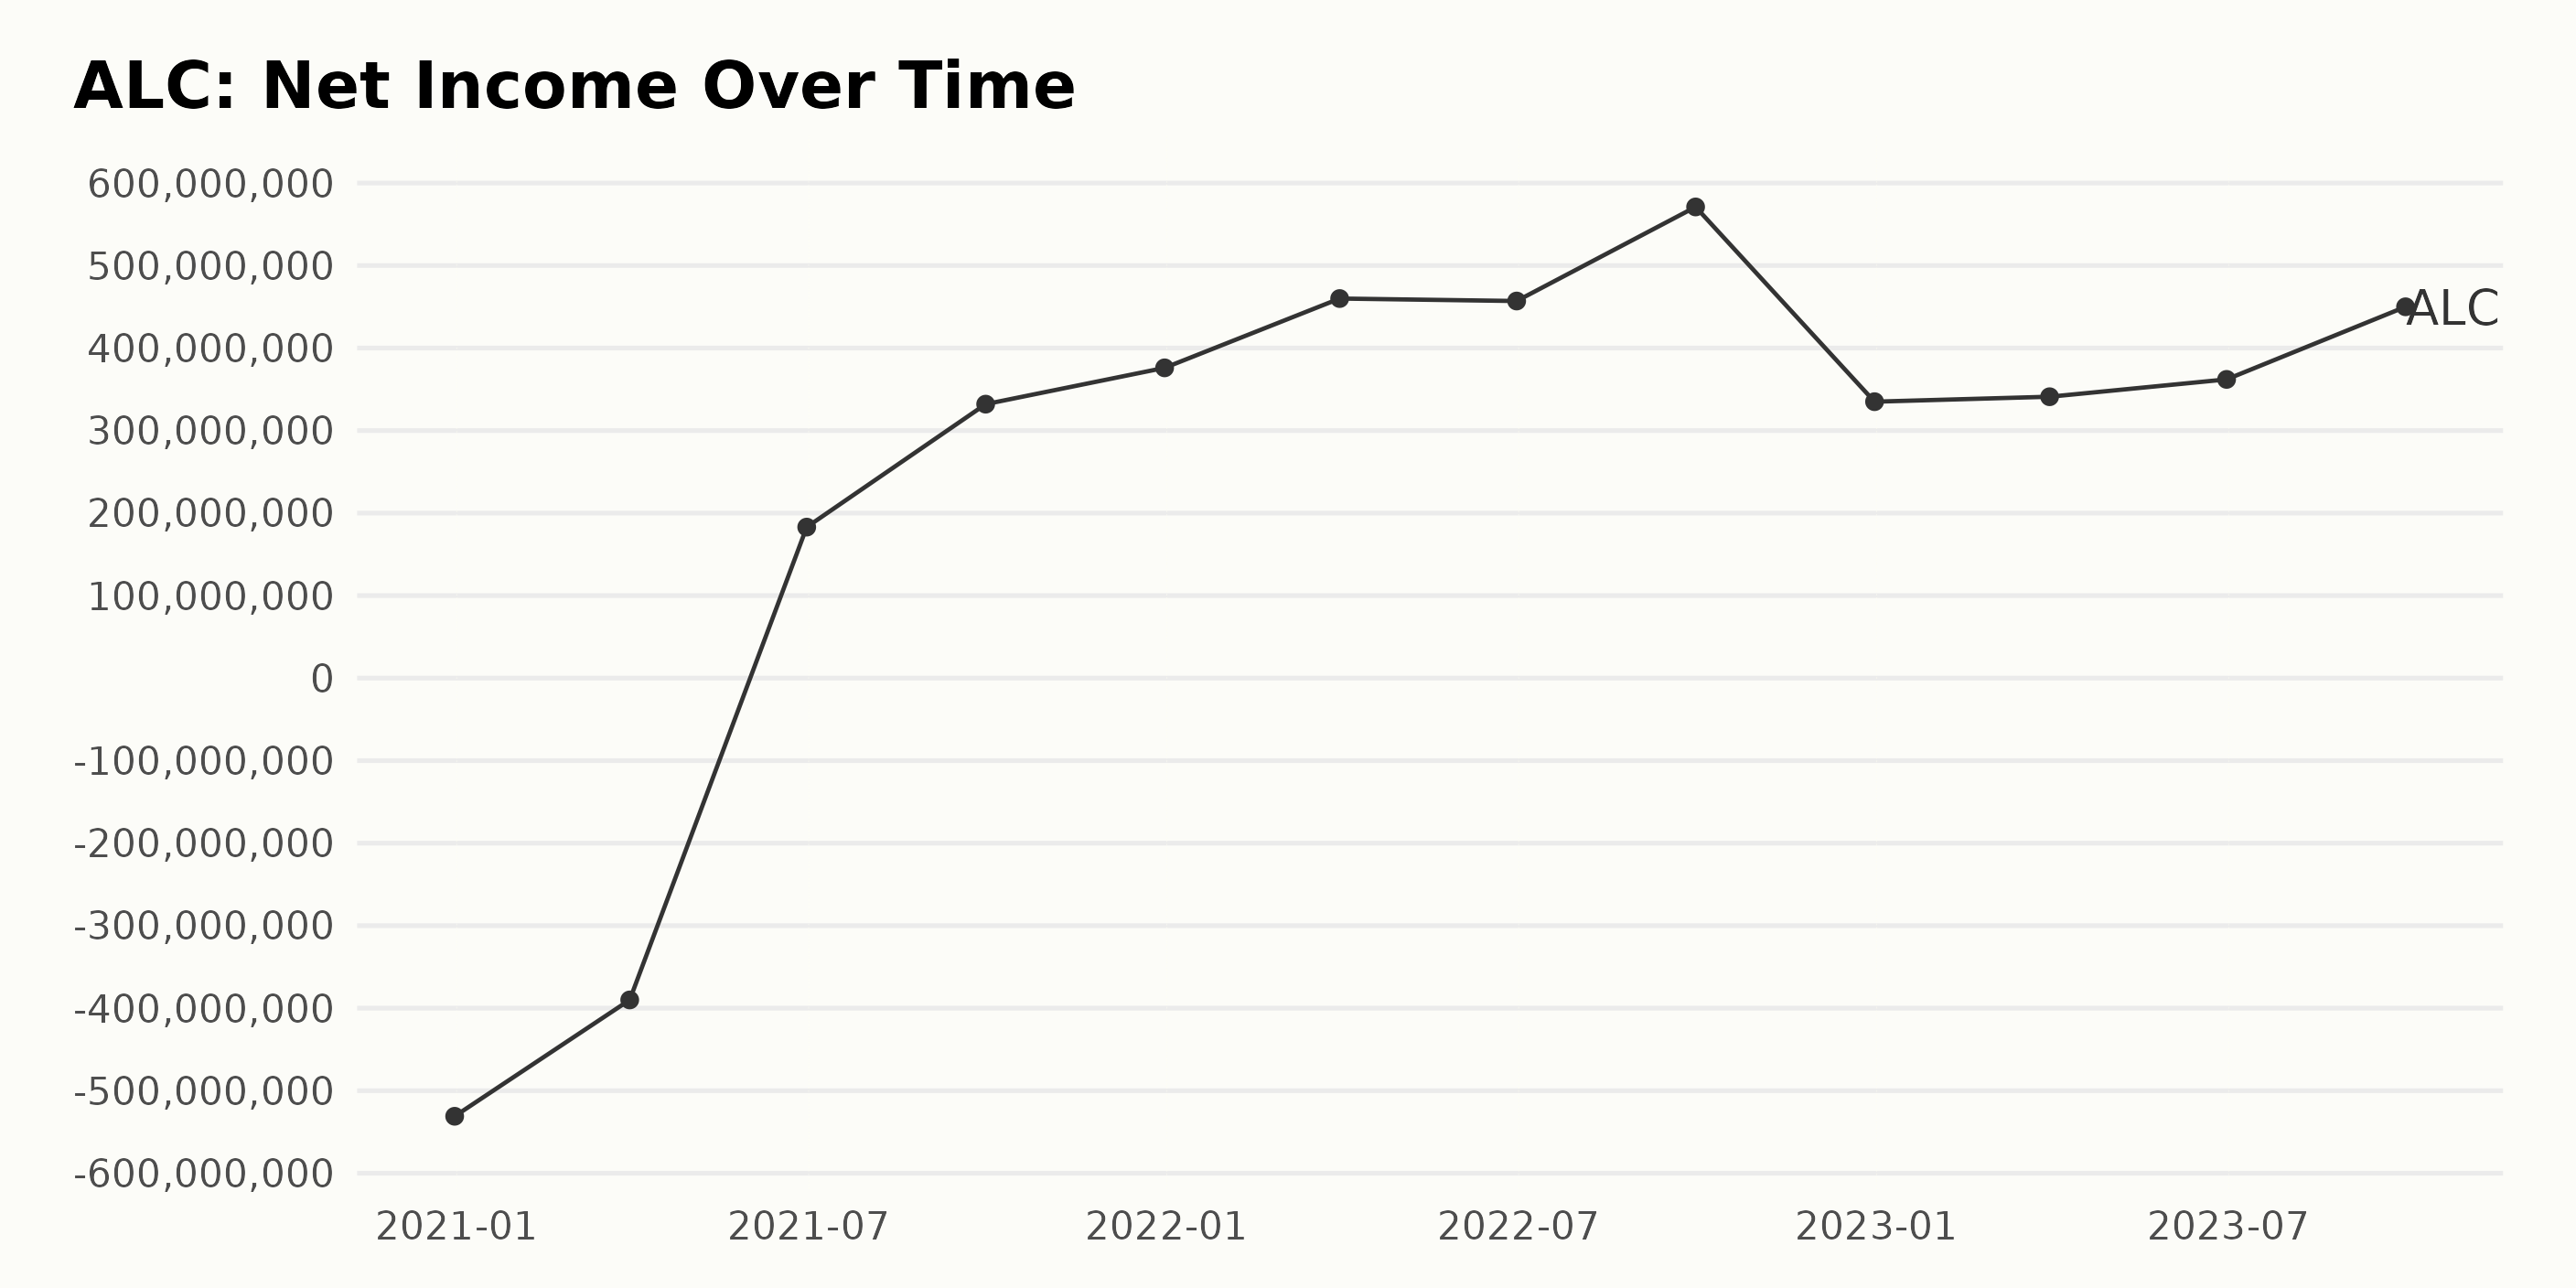
The trend for the trailing-12-month net income of ALC has seen significant fluctuations over the past few years.
- At the end of 2020, ALC faced a significant setback with a net income of -$531 million.
- By the first quarter of 2022, there was an observable upswing in net income to -$390 million, showing a recovery from the previous year-end loss.
- The progress continued through the second and third quarters of 2021, when ALC reported profits of $183 million and $332 million, respectively.
- The year 2021 ended on a positive note, with ALC reporting a net income of $376 million.
- ALC continued to maintain its profitability through the first three quarters of 2022, peaking at $571 million in the September quarter. However, it saw a dip to $335 million by the end of 2022.
- The company has been increasing its net income in 2023 steadily throughout the quarters, starting from $341 million and finally managing to reach $450 million by the end of September.
Taking into consideration the growth rate from the start of the series to the end, which is calculated by the difference between the first (-$531 million) and last value ($450 million), ALC has witnessed a significant overall increase.
Emphasizing recent data, we see ALC maintaining a consistent growth in net income in 2023, recovering from the slump at the end of 2022. The company ended the September quarter of 2023 with $450 million, indicating a promising upward trajectory.
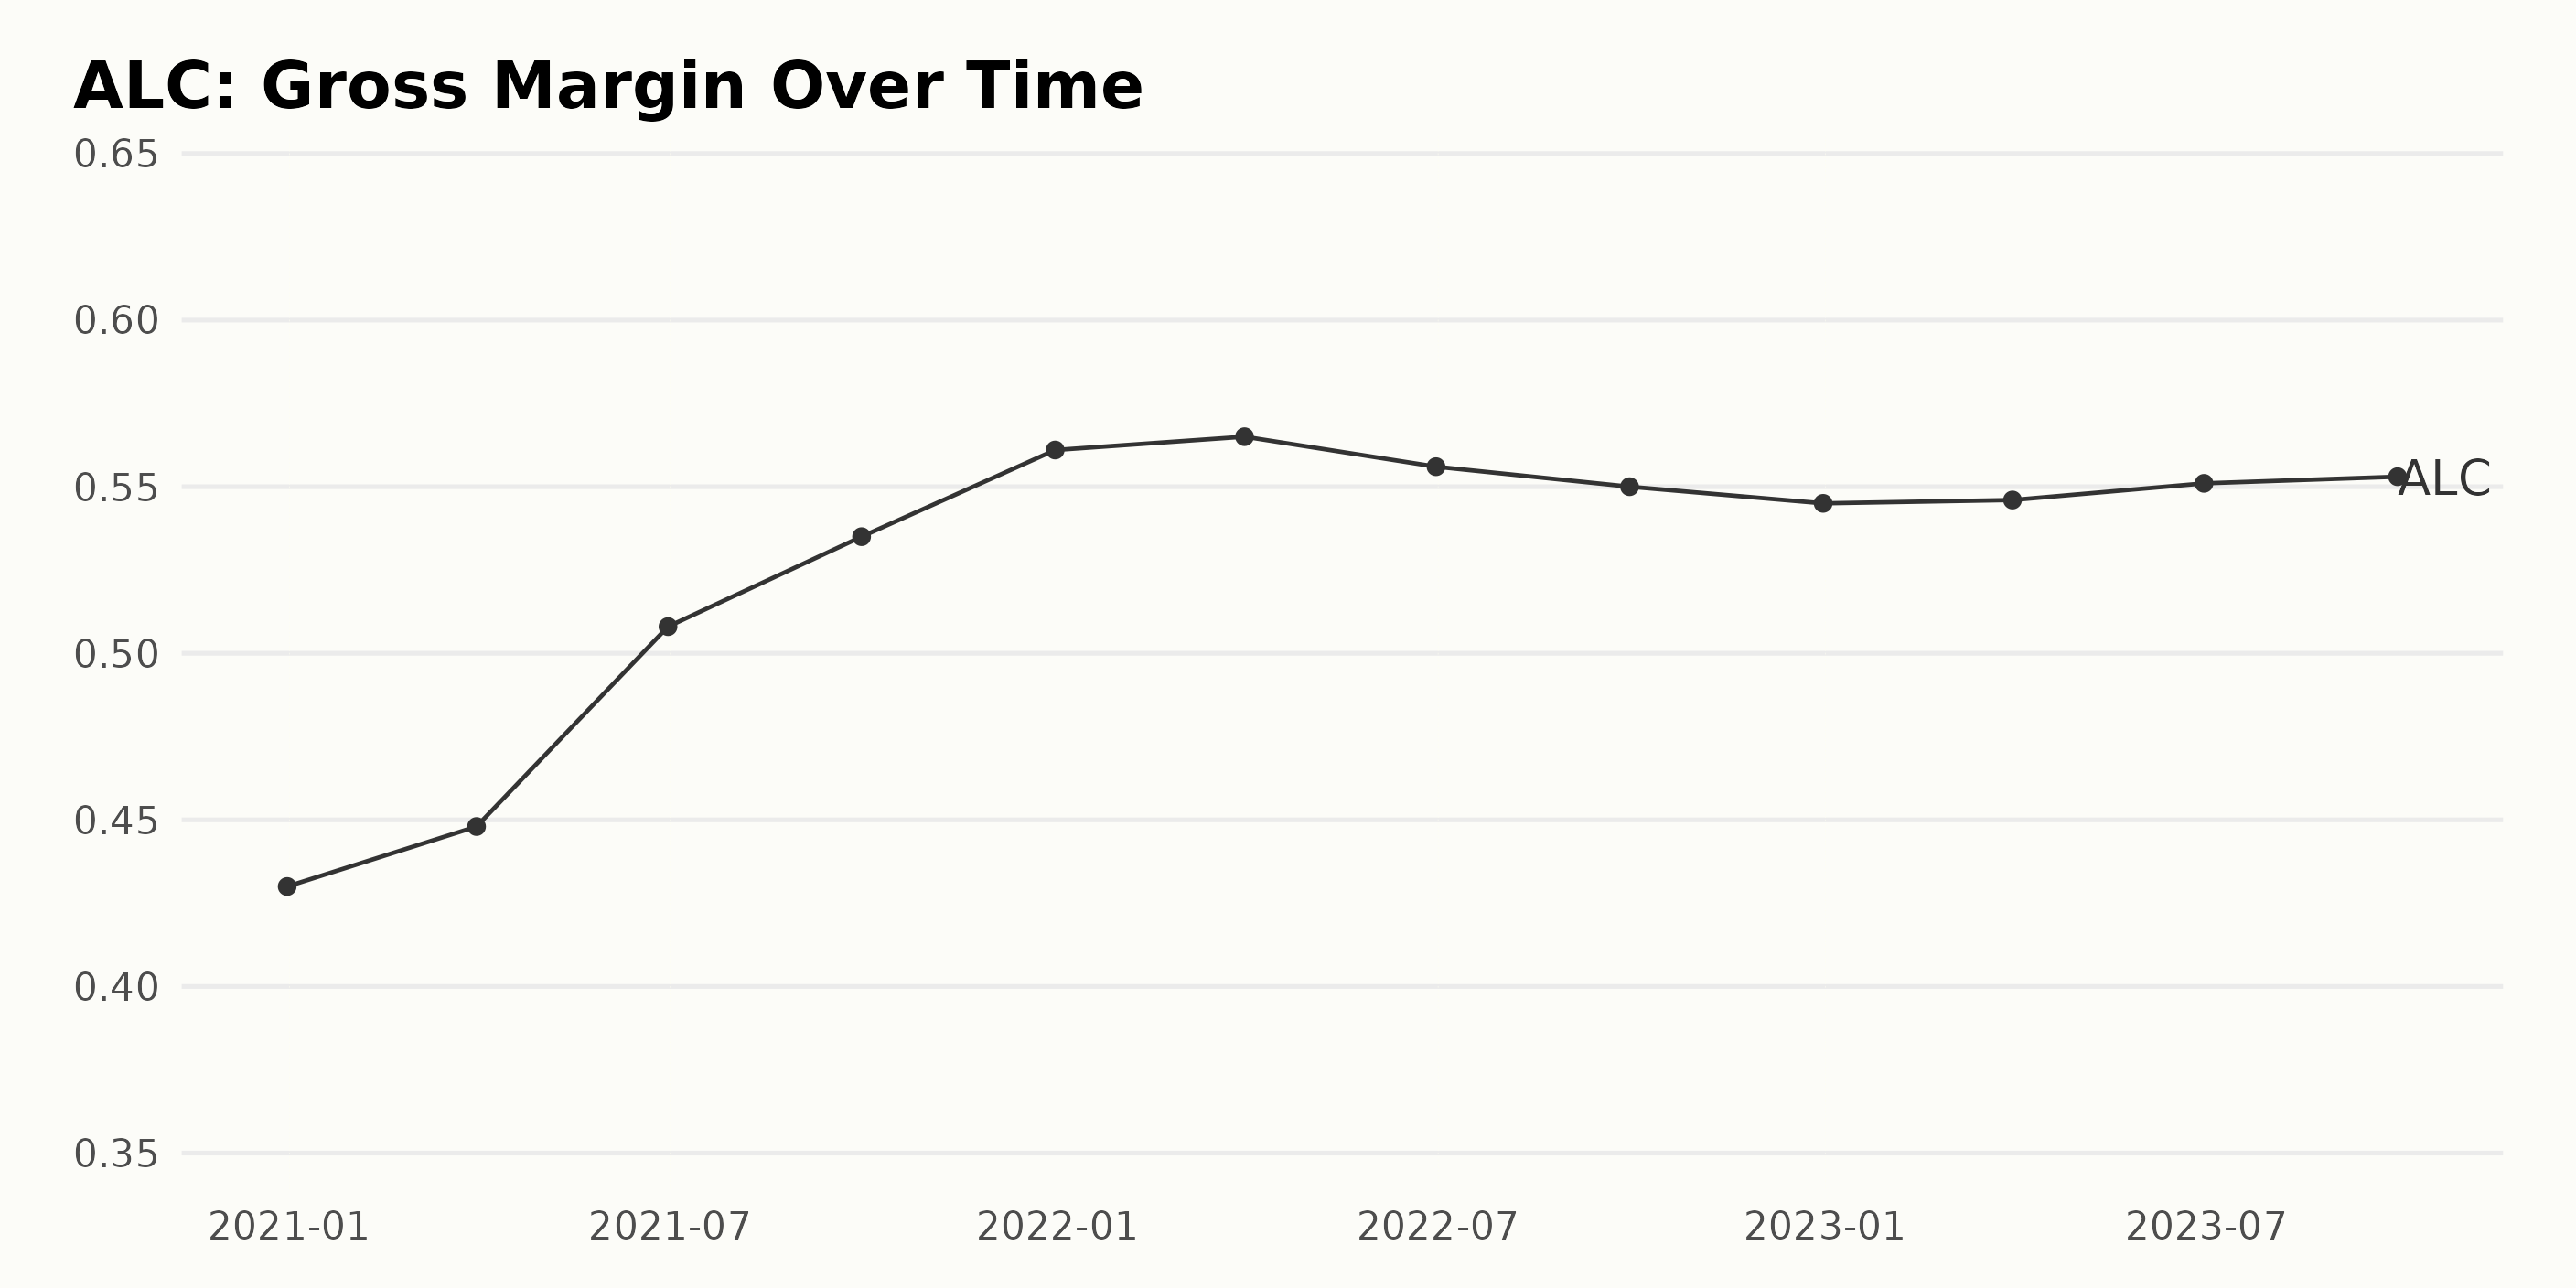
The gross margin of ALC has generally shown a positive trend over the given period, although there have been minor fluctuations observed. To represent the data in detail:
- On December 31, 2020, the gross margin was 43%
- By March 31, 2021, it increased to 44.8%
- There was a significant jump to 50.8% by June 30, 2021
- And a further increase to 53.5% by September 30, 2021
- On December 31, 2021, the gross margin rose again to 56.1%
- Despite a slight increase to 56.5% by the end of the first quarter in 2022, this value fell to 55.6% and then 55% in June and September, respectively
- However, the decrease trend continued till the end of 2022 with a rate of 54.5%
- In the first quarter of 2023, there was a negligible increase to 54.6%
- Finally, by June 30, 2023, the gross margin experienced another slight increase to 55.1% and climbed slightly to 55.3% by September of the same year.
Note that more recent data and the final values show a downward trend after reaching a peak in early 2022. It significantly increased from 56.5% in March 2022 to 55.3% in September 2023.
When measuring the growth rate from the first value (43% on December 31, 2020) to the last value (55.3% on September 30, 2023), there is a 12.3% increase in gross margin. It's also worth mentioning that the highest gross margin was reported on March 31, 2022, at 56.5%.
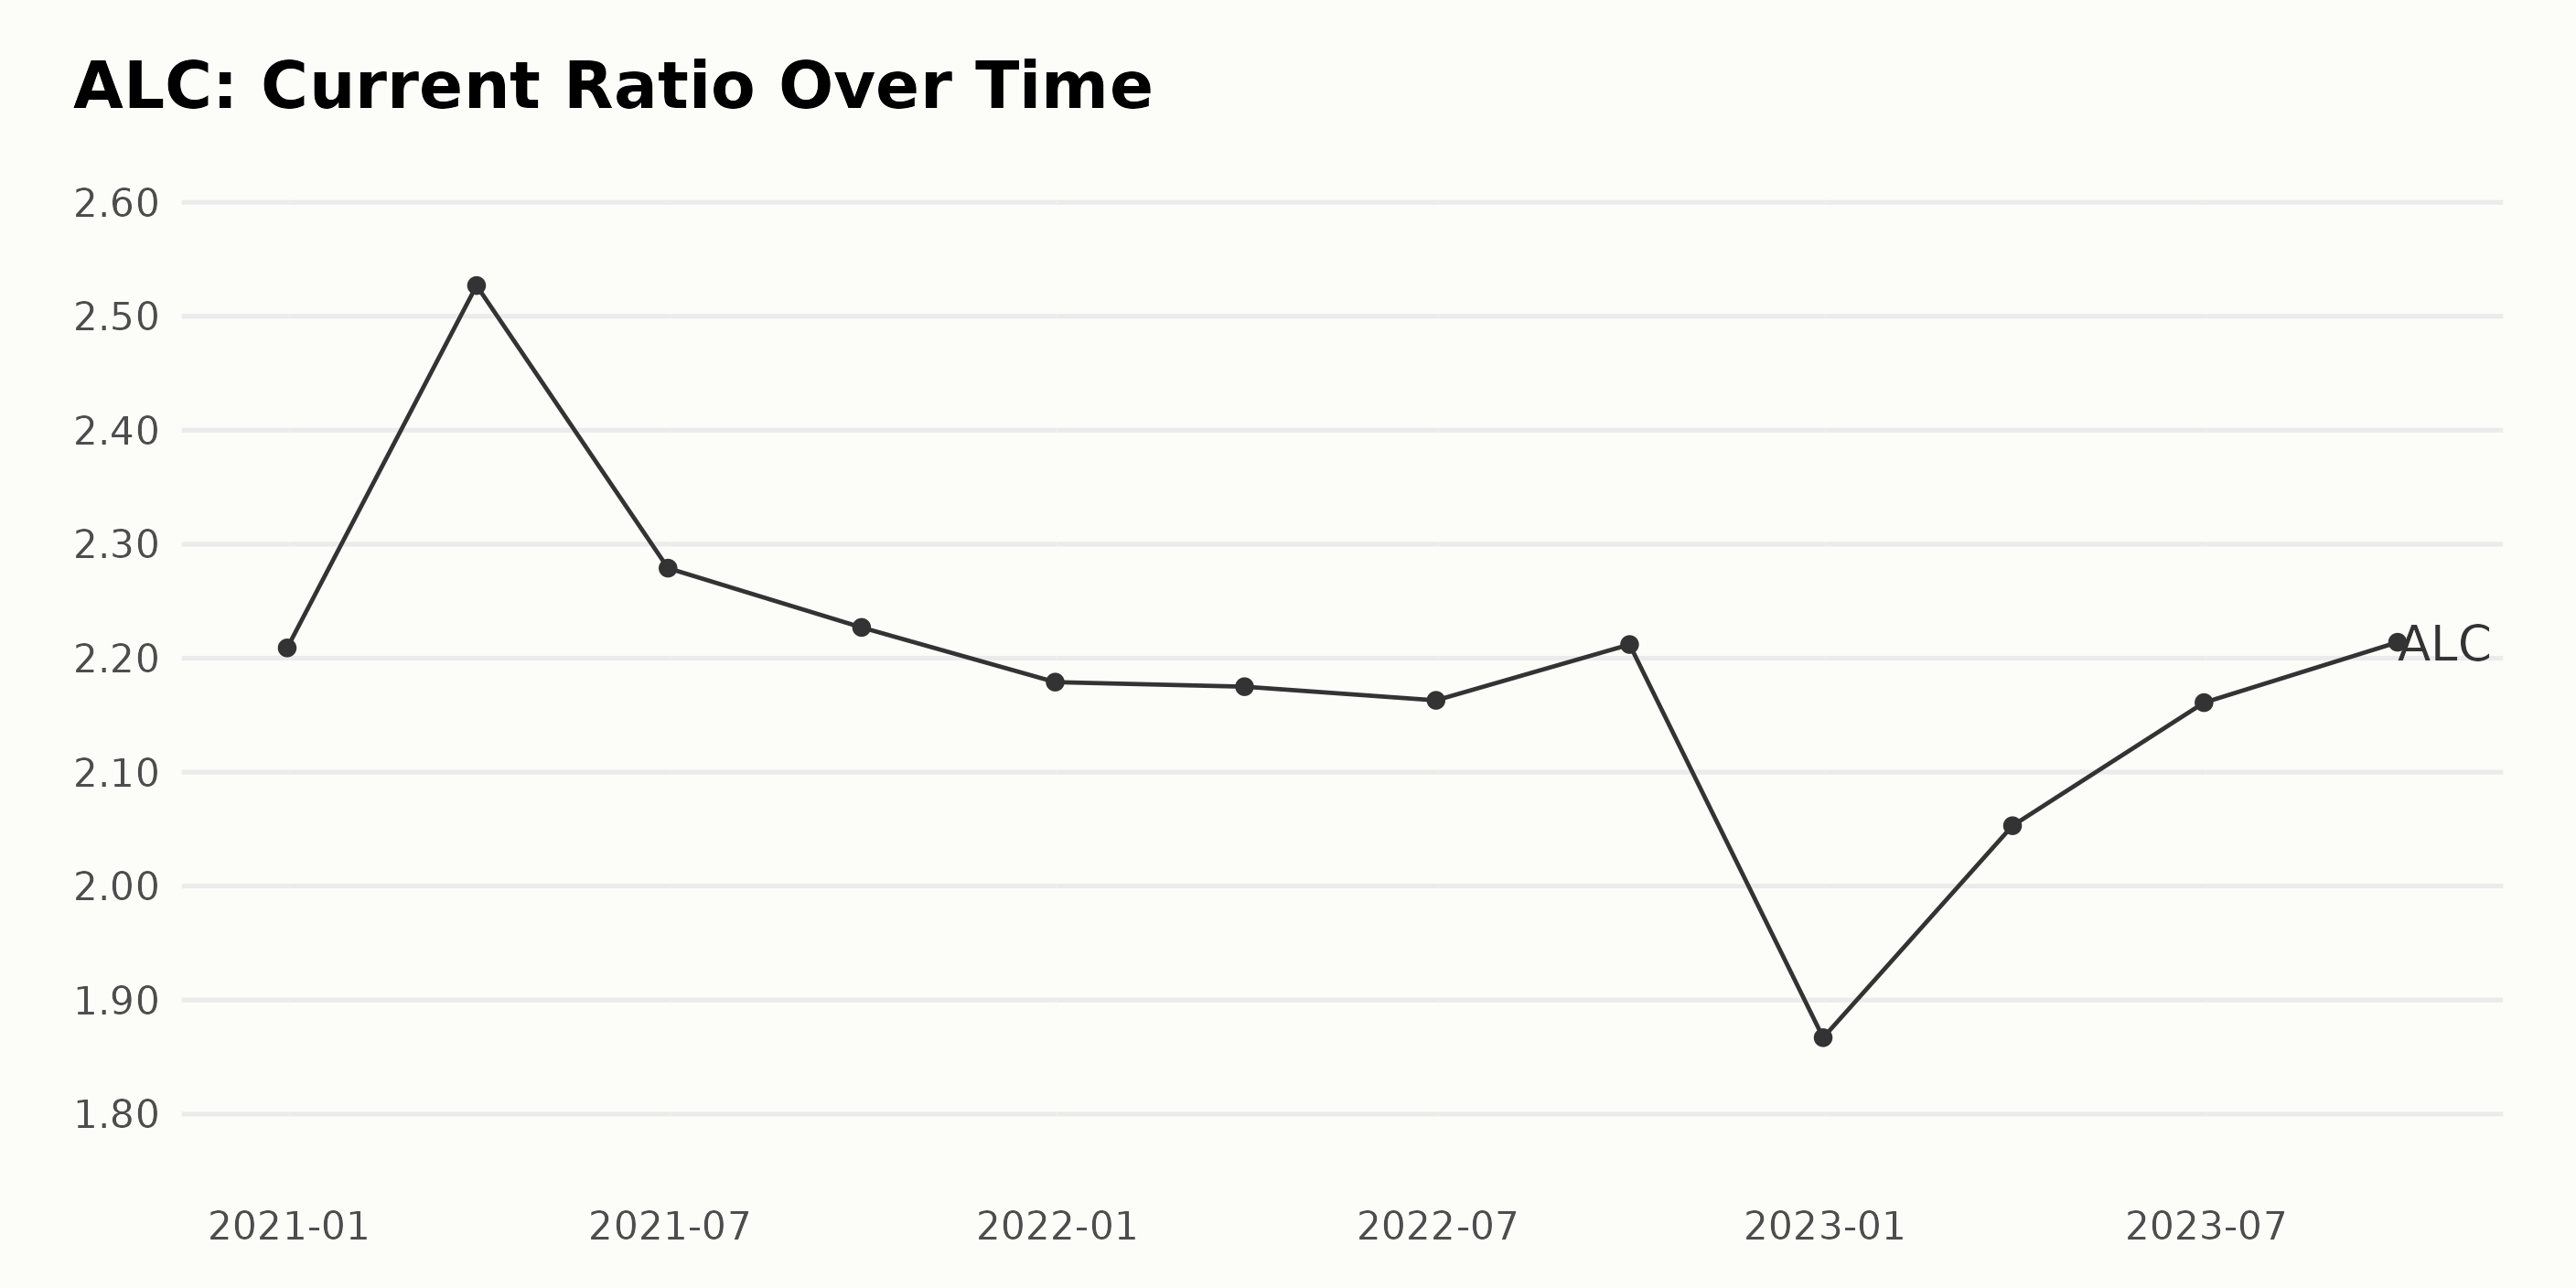
The current ratio of ALC experienced several fluctuations from December 2020 to September 2023:
- Starting at a ratio of 2.21 on December 31, 2020, it rose to 2.53 by March 31, 2021.
- However, the ratio displayed a general downward trend over the next year, reaching a low point of 1.87 on December 31, 2022.
- Despite this, ALC showed some recovery, moving back up to 2.21 by September 30, 2023.
It's worth noting that although the current ratio fluctuated, the overall change from the beginning (December 2020) to the end (September 2023) showed a slight decrease, with a growth rate of -0.0028 or -0.28%.
Notable Ratios:
- Highest Ratio: 2.53 (March 2021)
- Lowest Ratio: 1.87 (December 2022)
- Most Recent Ratio: 2.21 (September, 2023)
These figures suggest that, despite its volatility, the company's current ratio has managed to remain relatively stable over time.
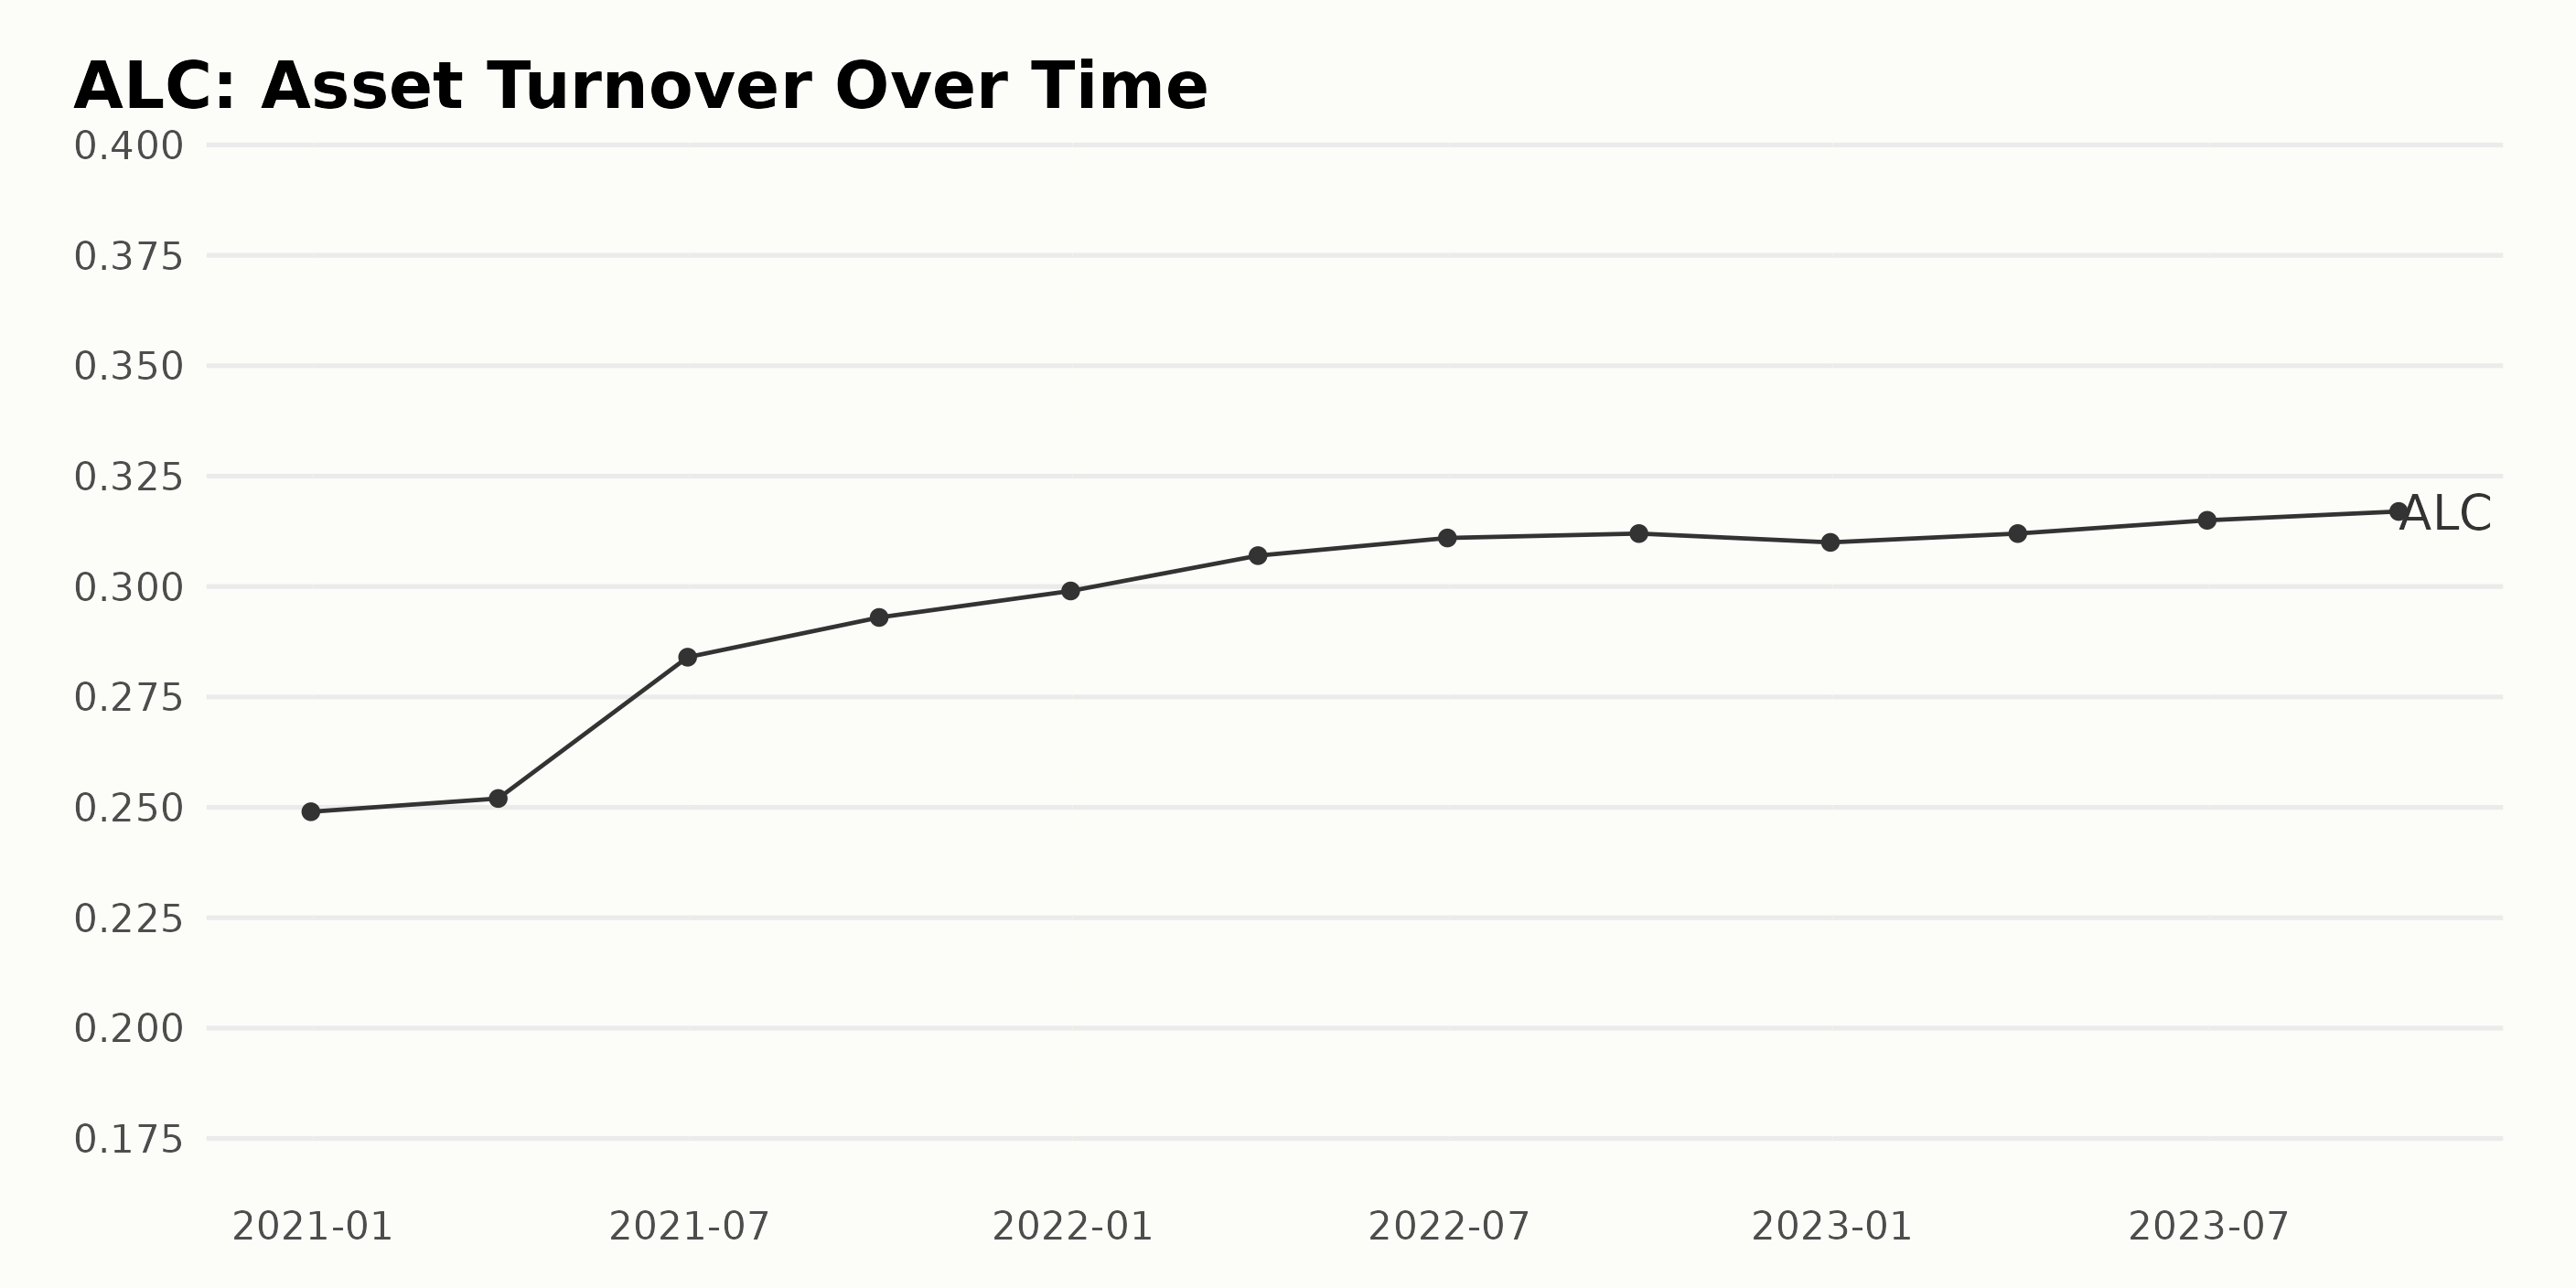
Looking into the asset turnover of ALC, we can witness a steady progressive trend in the values from 2020 to 2023. Here's a summary:
- In December 2020, ALC's asset turnover was 0.25.
- Reflecting a small incline, it nudged to 0.25 by March 2021.
- Then witnessed a more substantial rise to 0.28 by June 2021.
- The pattern of growth prevailed, leading to an Asset Turnover of 0.29 by the end of September 2021.
- By December 2021, it was pushed further up to a value of 0.30.
In the more recent data:
- There was marginal growth seen to 0.31 by March 2022.
- Maintaining stability at these increased levels, the asset turnover climbed a bit more to reach 0.31 by the end of June 2022.
- It slightly lifted to 0.31 by the end of September 2022.
- By December 2022, however, there seemed to be a minutely downward fluctuation, bringing it to 0.31.
The last part of the series:
- Into the next year, 2023, it steadily picked up strength, regaining 0.31 by the end of March.
- Continuing the upward trend, it touched 0.32 by the end of June 2023.
- The final data point reports that by the end of September 2023, ALC's Asset Turnover sustained growth to 0.32.
Overall, across this timeframe, the asset turnover of ALC went from 0.25 to 0.32, marking a growth rate of around 28%. While there have been slight fluctuations, the primary trend leans towards progressive growth with greater emphasis on later data points.
Analyzing ALC's Share Price: A General Growth Trend with Fluctuations
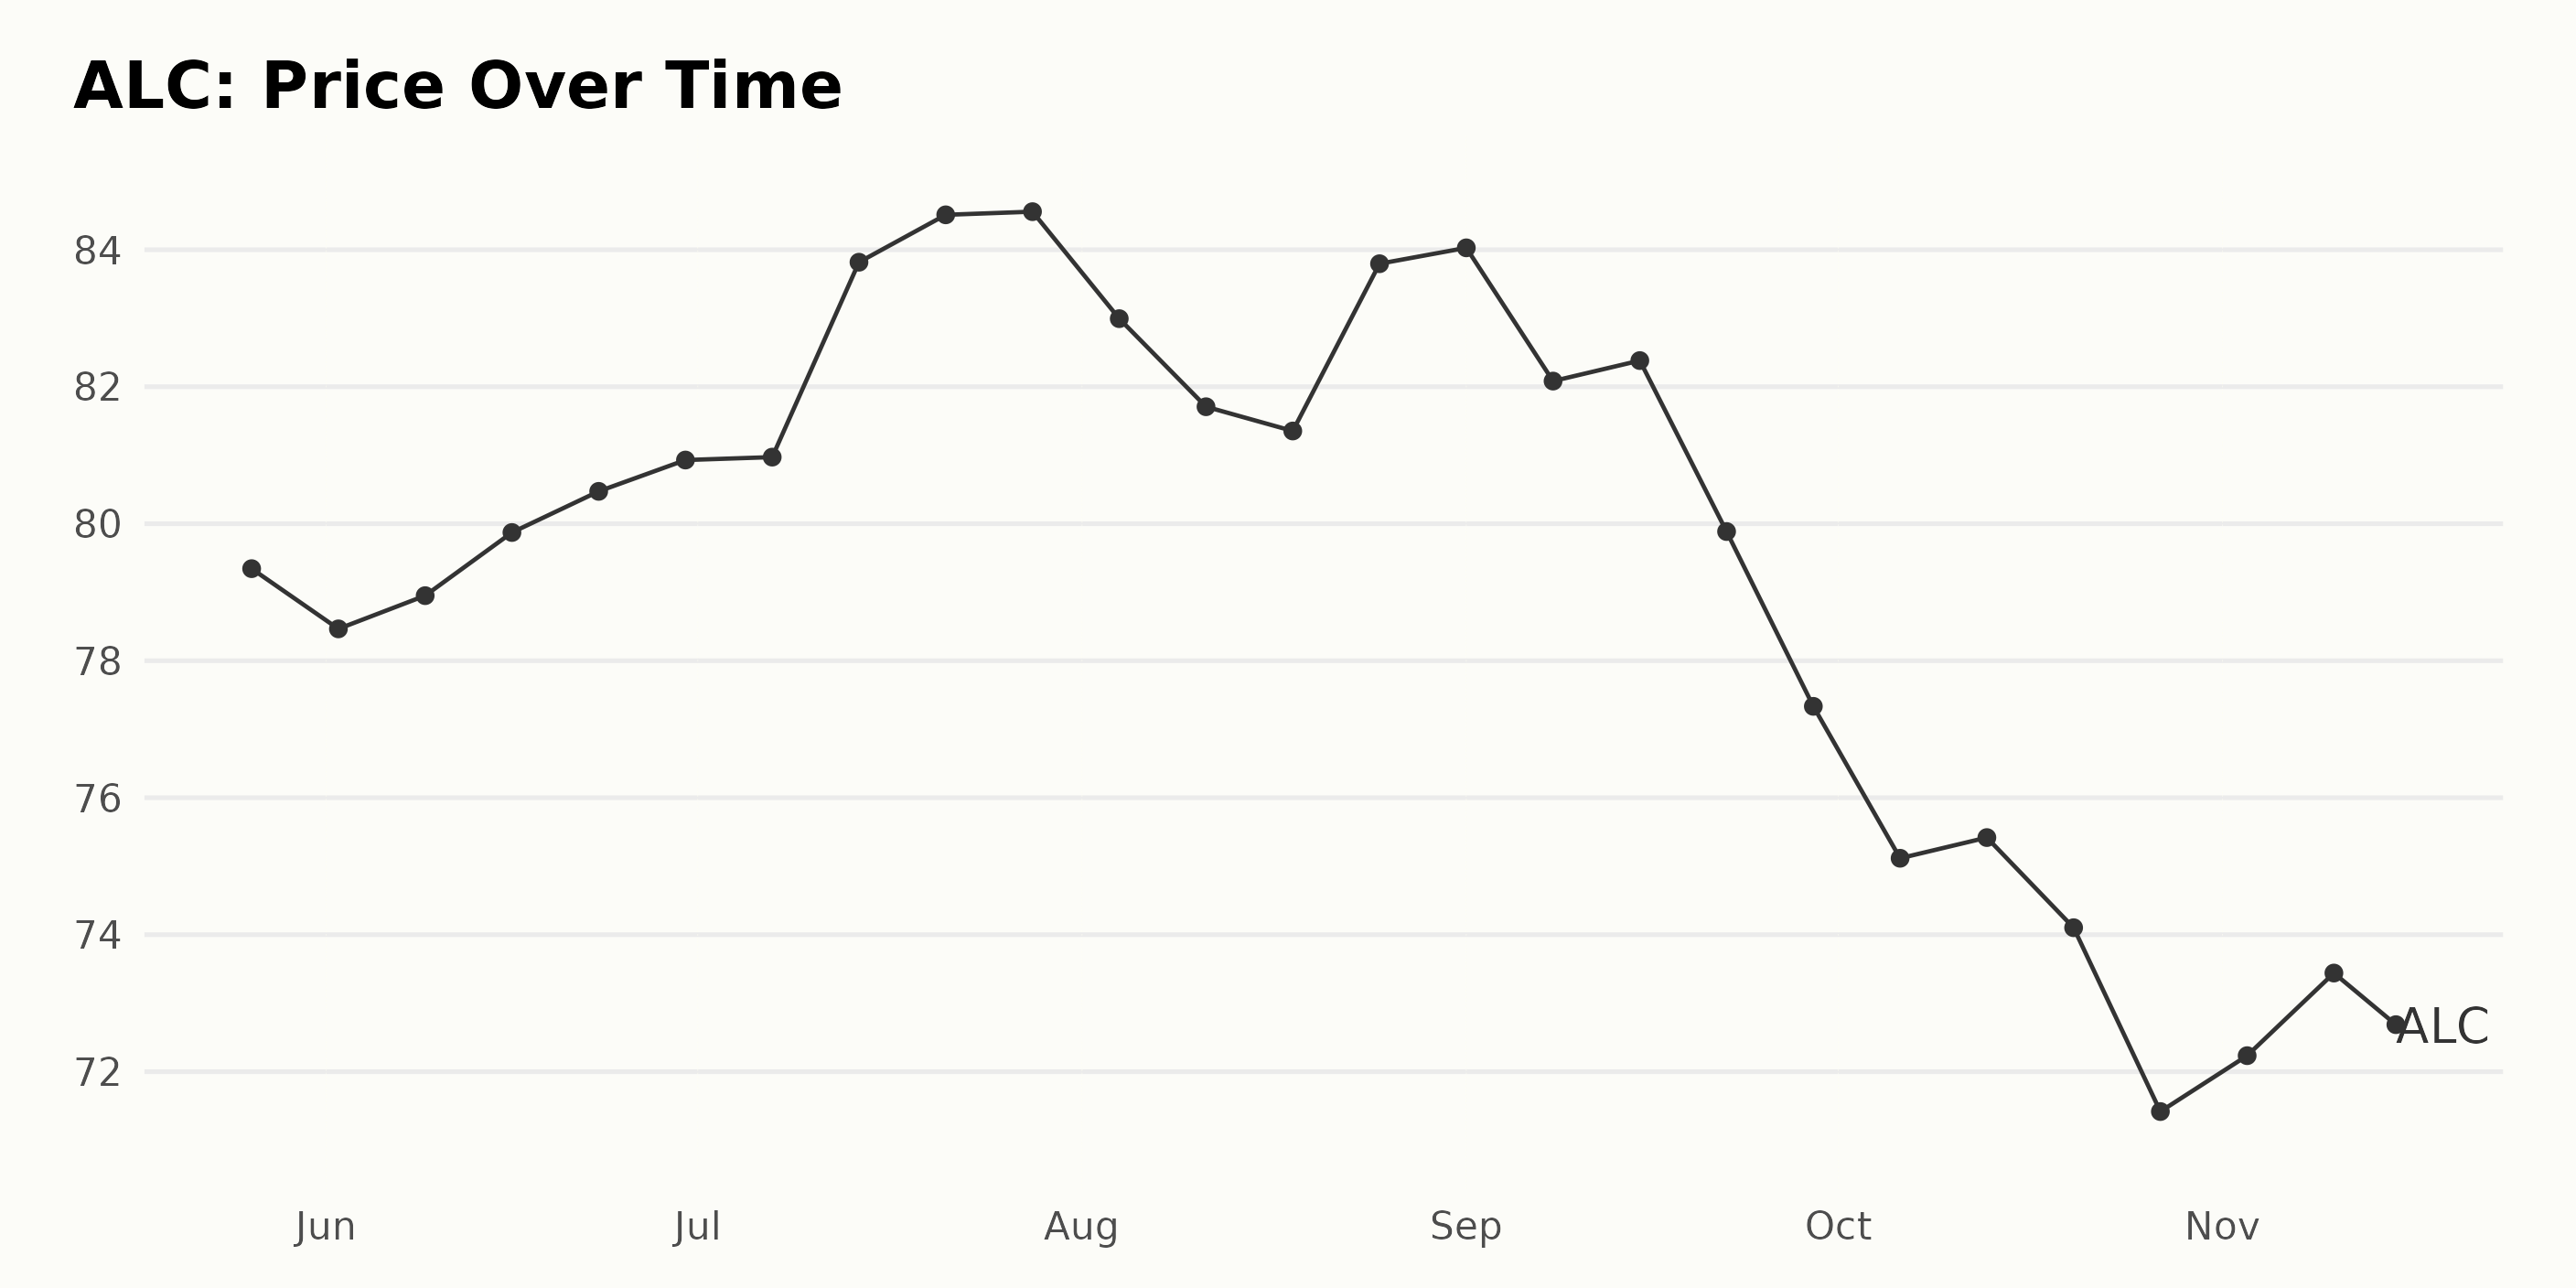
The data for the ALC share price shows fluctuations over time. Here is a more detailed description:
- The share price of ALC on May 26, 2023, was $79.34.
- Throughout June, the price fluctuated but ended with a slight increase, reaching $80.93 by the end of June.
- In July, the ALC shares experienced a significant spike, reaching the highest value during this period of $84.56.
- In August, we see a small deceleration in the growth rate as the price drops briefly to $81.35 before bouncing back to end the month at $83.80.
- September again witnessed a decrease until the end of the month when the shares fell down to $77.33.
- In October, the downward trend continued, and the ALC shares reached their lowest point for the period at $71.42 by the end of the month.
- The stock closed its last trading session at $70.53.
In summary, the data shows an overall trend of growth with some periods of deceleration. Please note that past behavior does not always predict future trends, and this analysis only reflects the data provided. Here is a chart of ALC's price over the past 180 days.
Analyzing ALC's POWR Ratings: Steady Growth, Improving Stability, and Fluctuating Sentiment
The POWR Ratings Grade of ALC, a stock in the Medical - Devices & Equipment category, is essential to understand its overall performance within the industry and relative to its competitors. Here's an account of the journey by ALC’s POWR Grade from May 2023 till November 2023.
- Beginning from May 2023 until early August 2023, ALC maintained a consistent POWR Grade of B (Buy).
- Its rank varied slightly during this period but stayed below #30. This means that ALC was performing better than the majority among the 145 stocks in the category for this duration.
- On August 19, 2023, there was a drop in the grade to C (Neutral), with a rank of #49, which signals a decrease in ALC's comparative industry performance.
- However, by August 26, 2023, ALC rebounded back to POWR Grade B (Buy) and continued to persist with it through the end of October 2023, with its rank gradually fluctuating between #25 and #35.
- In November, the POWR grade slipped to C (Neutral) again, and its rank increased to #39 on November 10, 2023, and further deteriorated to #60 by November 15, 2023.
As of the most recent date of November 15, 2023, ALC's POWR Grade stands at C (Neutral) with a rank of #60 in the Medical - Devices & Equipment category.
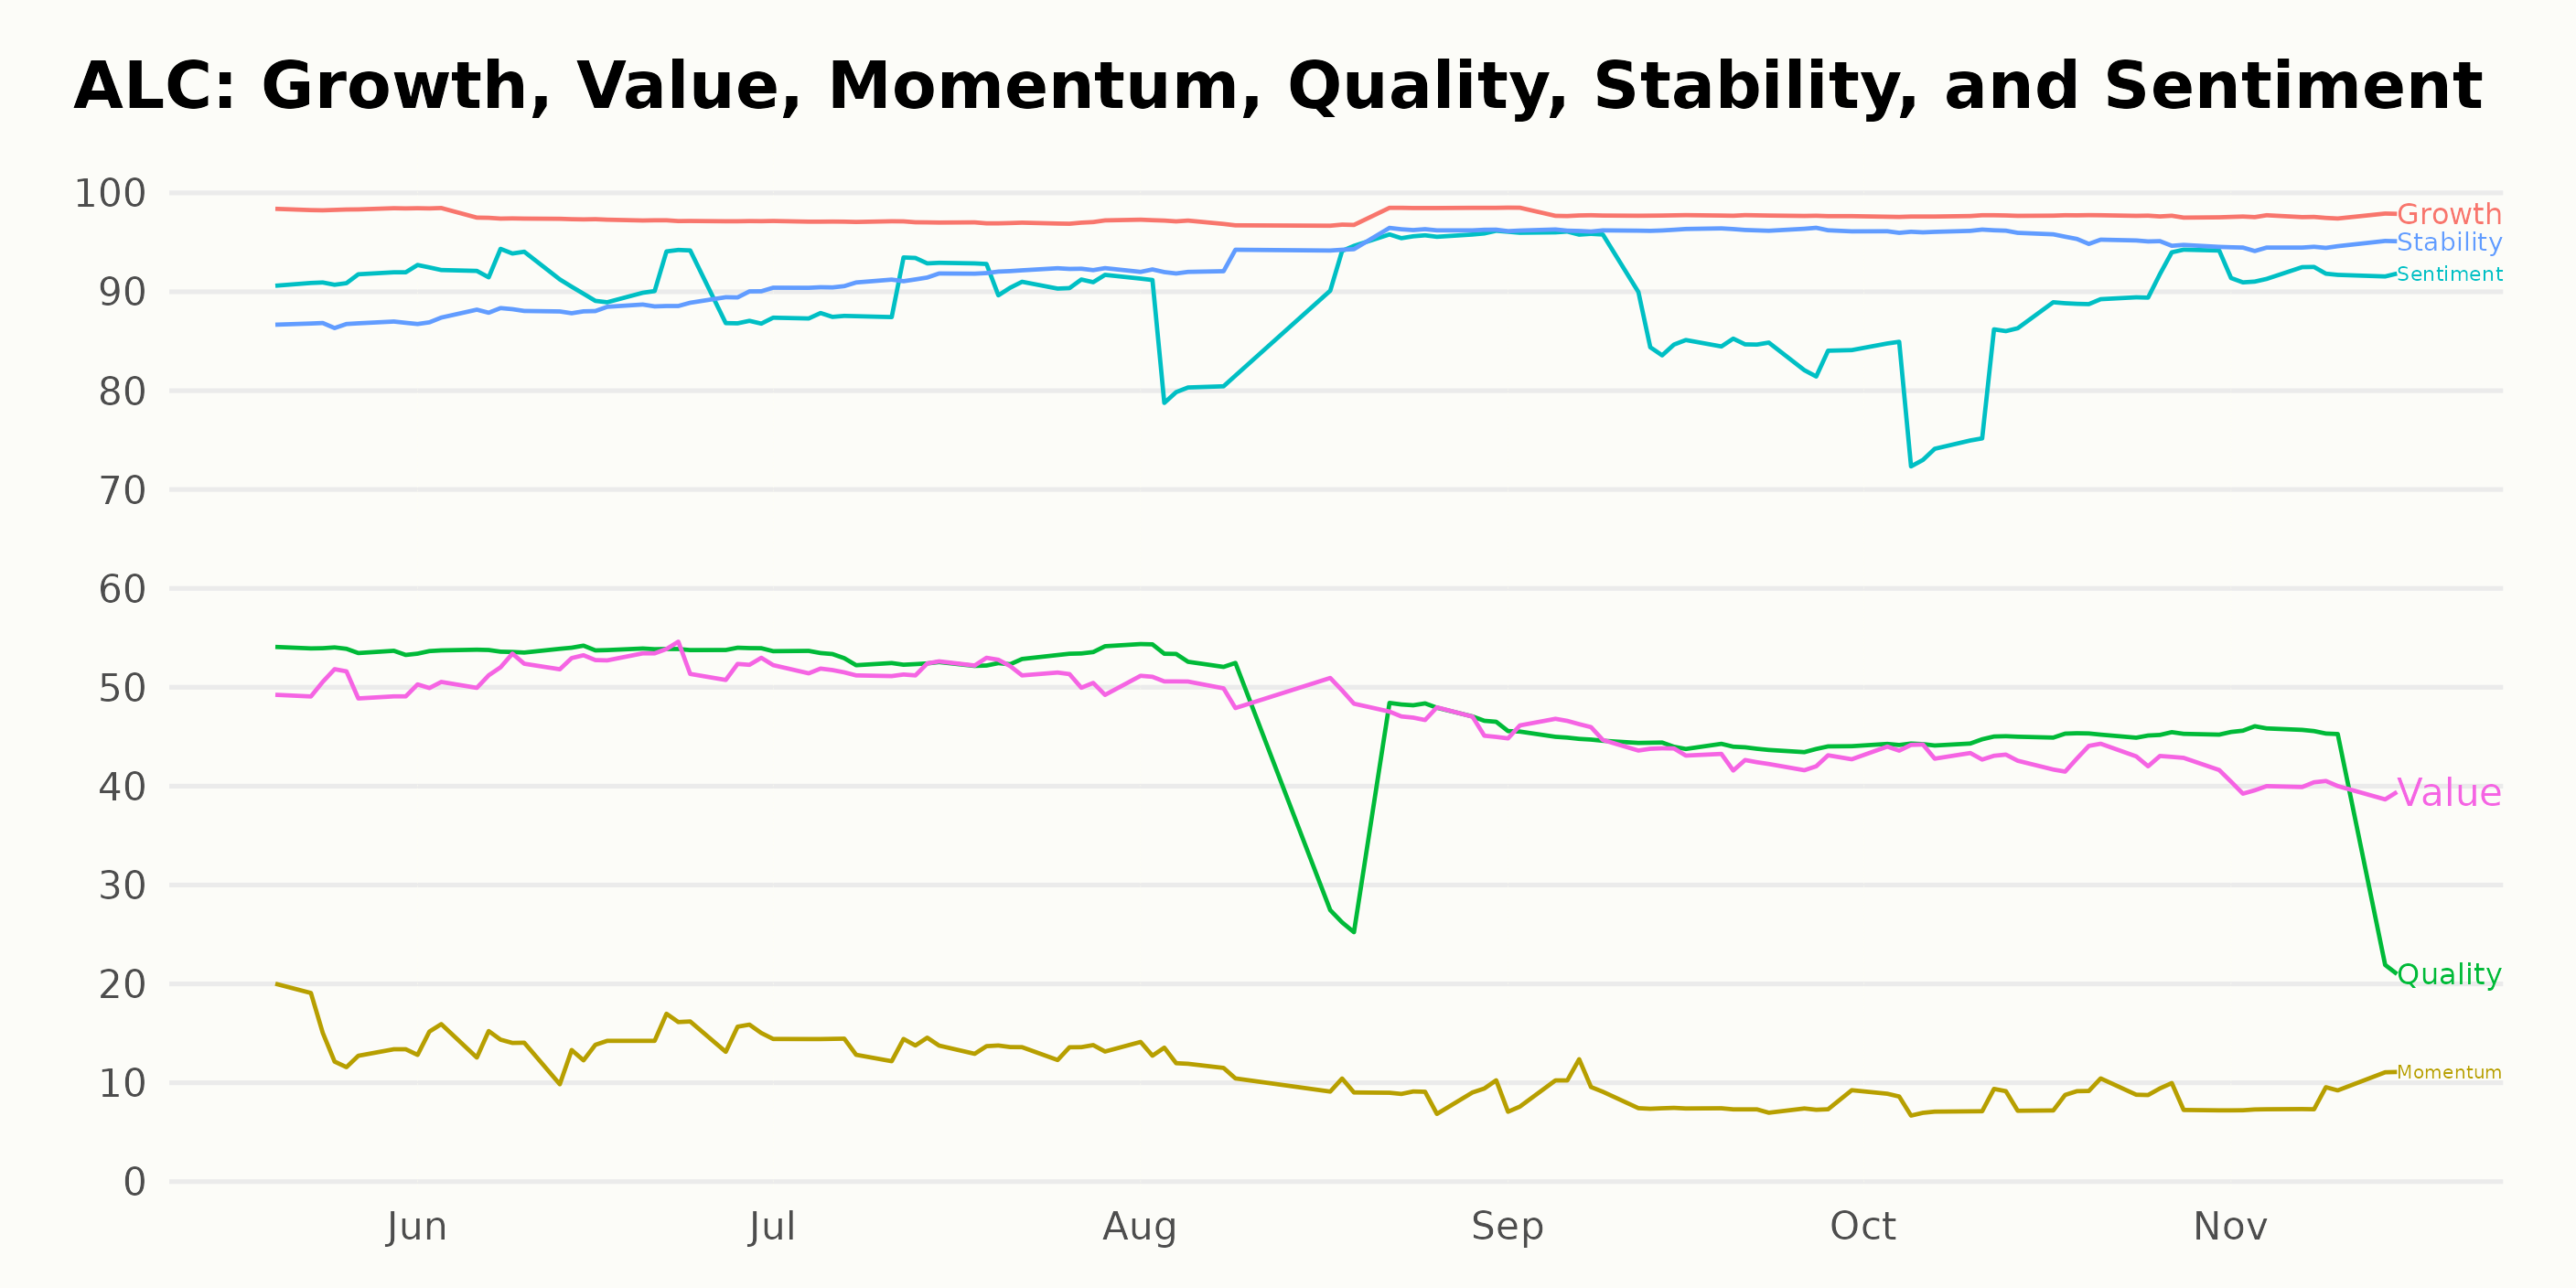
The POWR Ratings for ALC across its most noteworthy dimensions - namely Growth, Stability, and Sentiment, over the noted period show interesting trends.
- Growth: Holding an impressively high value, Growth remains a significant aspect throughout, resting at 98 in May 2023, dipping slightly to 97 between June and July 2023, but returning to 98 from August through November 2023.
- Stability: This dimension highlights a clear trend of improvement. Starting at 87 in May 2023, it progressively rises, reaching its peak at 96 between September and October 2023 and slightly decreasing to 95 by mid-November 2023.
- Sentiment: While the sentiment rating began at a strong 91 in May 2023, there is a slight decrease observed over time. It experiences drops, settling at 85 by October 2023 before rebounding back to 92 by mid-November 2023.
These findings present ALC's highest ratings, largely dominated by Growth along with a positive trend in Stability and variable, though still high, Sentiment.
How does Alcon Inc. (ALC) Stack Up Against its Peers?
Other stocks in the Medical - Devices & Equipment sector that may be worth considering are FONAR Corporation (FONR), MiMedx Group, Inc. (MDXG), and Varex Imaging Corporation (VREX) - they have better POWR Ratings. Click here to explore more Medical - Devices & Equipment stocks.
What To Do Next?
Discover 10 widely held stocks that our proprietary model shows have tremendous downside potential. Please make sure none of these “death trap” stocks are lurking in your portfolio:
ALC shares were trading at $70.16 per share on Thursday afternoon, down $0.37 (-0.52%). Year-to-date, ALC has gained 2.35%, versus a 18.73% rise in the benchmark S&P 500 index during the same period.
About the Author: Anushka Dutta

Anushka is an analyst whose interest in understanding the impact of broader economic changes on financial markets motivated her to pursue a career in investment research.
The post Assessing Alcon Inc.’s (ALC) Post-Earnings Prospects: Is It Time to Invest, Hold, or Let Go? appeared first on StockNews.com