


Famous ride-hailing tech company Uber Technologies, Inc. (UBER) is facing heightened competition from Lyft, Inc. (LYFT) due to its price cuts. This is expected to dent UBER’s market share. However, it seems unlikely that LYFT’s strategy would affect UBER’s position as a market leader.
After a 16% year-over-year rise in gross bookings for the second quarter to $33.6 billion, UBER expects third-quarter gross bookings to be between $34.0 billion and $35.0 billion, while its adjusted EBITDA is anticipated to be between $975 million and $1.025 billion.
On the contrary, UBER is concerned that fuel costs might be a “tipping point” for carriers. UBER’s freight division has also experienced a 30% year-over-year reduction in revenue in the second quarter. In February, this segment cut 3% of its workforce and had a second round of layoffs in July.
On top of it, New York Attorney General Letitia James announced that UBER will pay some $290 million in a settlement fund as back pay to current and former drivers following a multi-year investigation.
Given this backdrop, let’s look at UBER’s key financial metrics trends to understand why it could be wise to wait for a better entry point in the stock before its third-quarter earnings release this Tuesday.
Analyzing UBER's Financial Performance: A Rollercoaster of Fluctuations from 2020 to 2023"
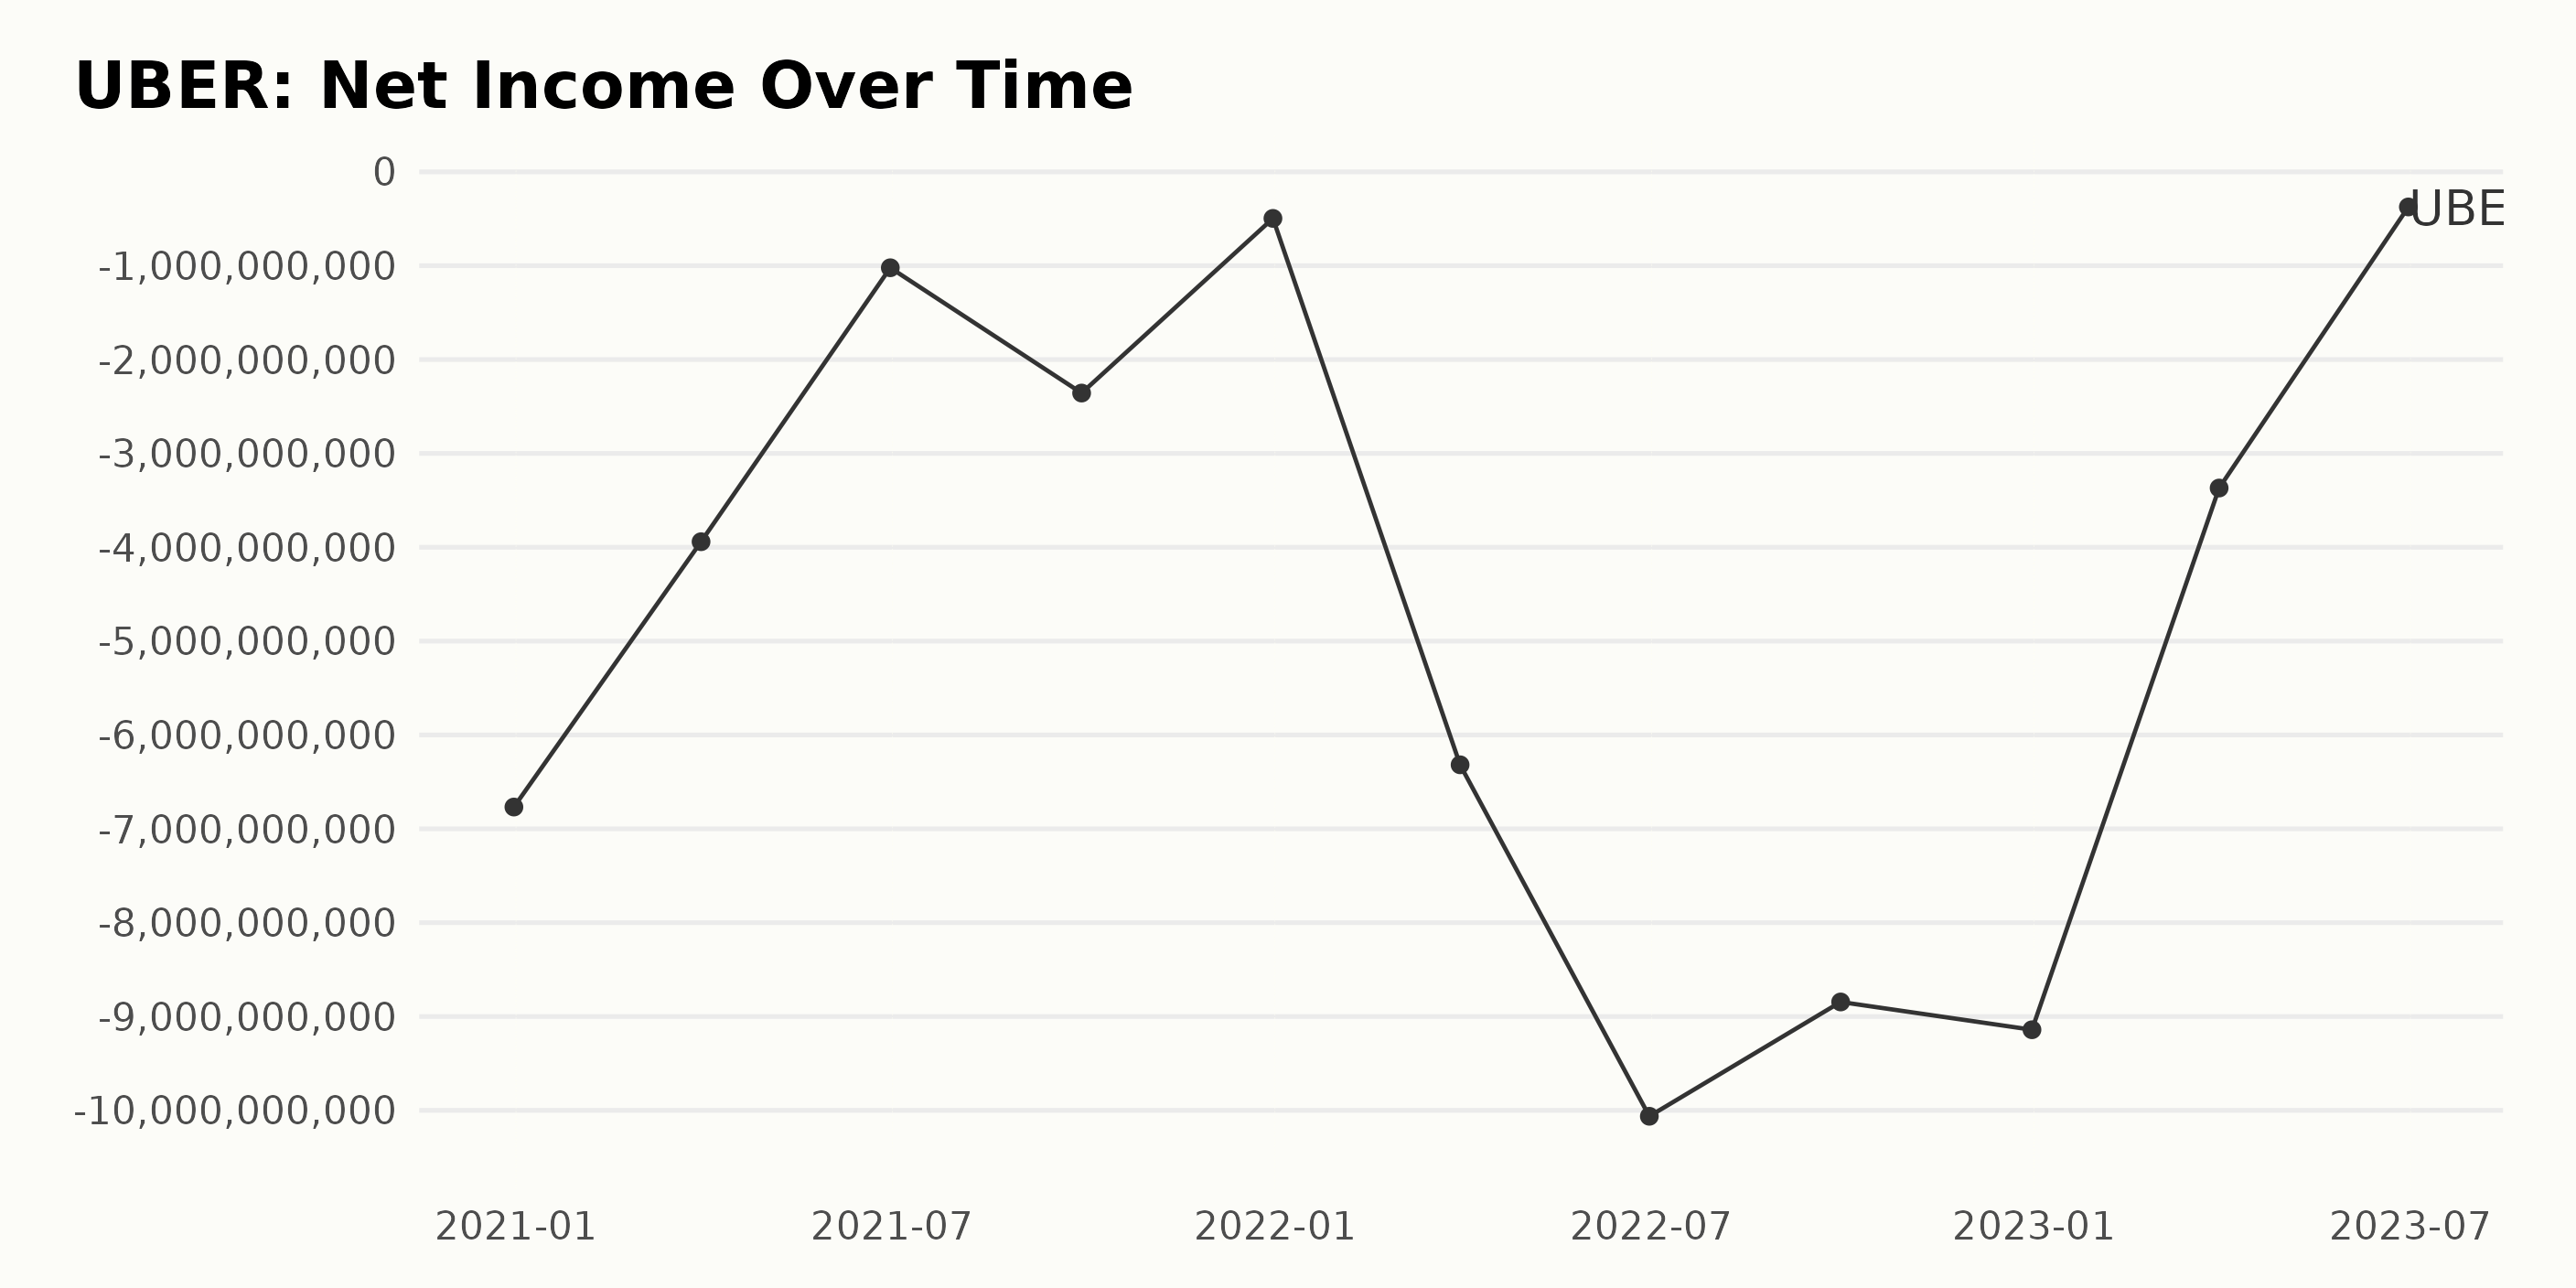
Here is the summary of the trailing-12-month net income trend and fluctuations for UBER over the periods provided:
- In December 2020, UBER reported a net income of -$6.77 billion.
- The first quarter of 2021 saw an improvement, with a decrease in the negative Net Income to -$3.94 billion.
- By June of that year, the company's losses were dramatically reduced to -$1.02 billion.
- However, in September 2021, the net income drastically fell to -$2.36 billion.
- Yet in December 2021, a remarkable improvement was made as the net loss decreased significantly to -$496 million, marking its lowest point since December 2020.
- Unfortunately, this upward trend did not continue and declined to -$6.32 billion by the end of March 2022.
- A massive dip occurred in June 2022 when the net income hit its lowest point at -$10.06 billion.
- There was a slight improvement during the end of September 2022 to -$8.85 billion.
- By the end of December 2022, the negative net income increased slightly to -$9.14 billion.
- Thereafter, there was a significant drop in losses at the end of the first quarter of 2023 to -$3.37 billion.
- The most recent data, up till June 2023, shows a major increase in losses, which stand at -$374 million, marking the lowest net loss since December 2021.
Overall, from December 2020 to June 2023, UBER has presented a fairly fluctuating net loss scenario. From the first value measured in December 2020 (-$6.77 billion) to the last value in June 2023 (-$374 million), UBER managed to decrease its net losses on a larger scale, signifying an overall growth rate of positive 94.5%.
However, this has been achieved with several fluctuations, making the net income trend for UBER quite volatile during this period.
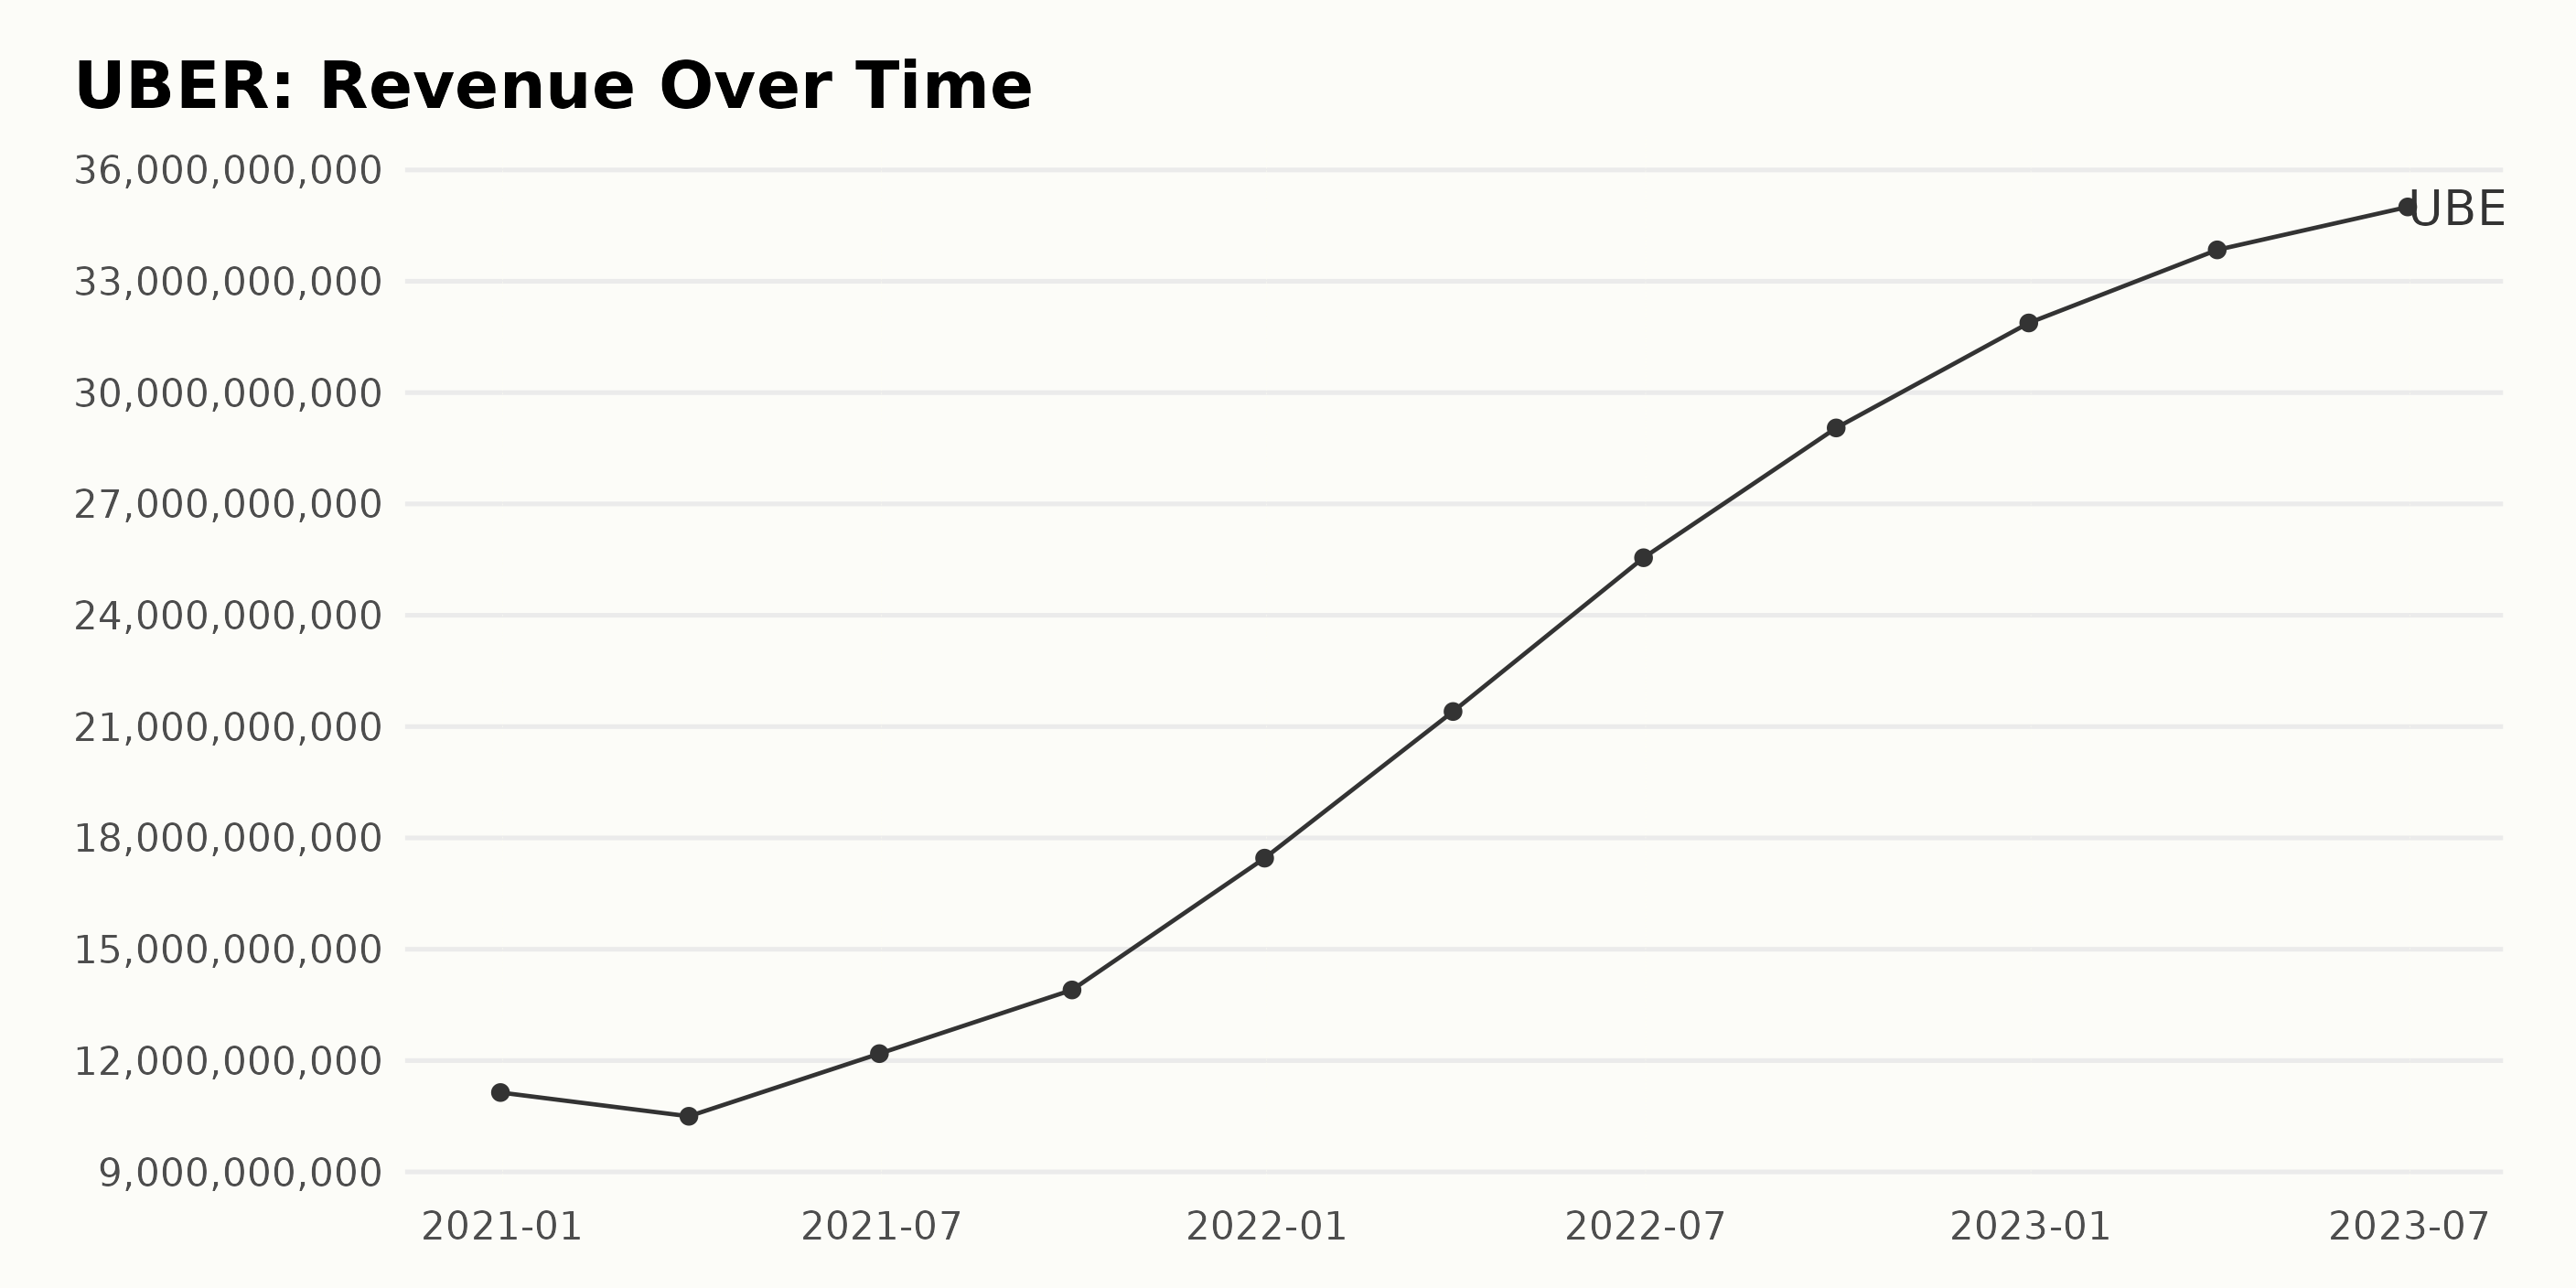
The trailing-12-month revenue trend for UBER experienced steady gains from December 2020 to June 2023. The reported revenue has observed significant fluctuations during this period:
- On December 31, 2020, the revenue was $11.14 billion.
- In the first quarter of 2021, it dipped to $10.50 billion but quickly recovered by the second quarter, reaching $12.19 billion.
- By the third quarter of 2021, revenue reached $13.90 billion and ended the year on a high note of $17.46 billion in the fourth quarter.
- For the first three quarters of 2022, there were consistent increases: first quarter at $21.41 billion, second quarter at $25.55 billion, and third quarter at $29.05 billion.
- By the fourth quarter of 2022, the revenue peaked at $31.88 billion before the growth rate slowed down in 2023.
- As of the first quarter of 2023, the revenue was $33.85 billion, with minor growth observed in the second quarter of 2023, where it was benchmarked at $35.00 billion.
Analyzing from the first value to the last, there is a clear overall upward trajectory in UBER's revenue. The calculated growth rate from December 2020 to June 2023 is approximately 214%, evidencing robust financial performance over this time period.
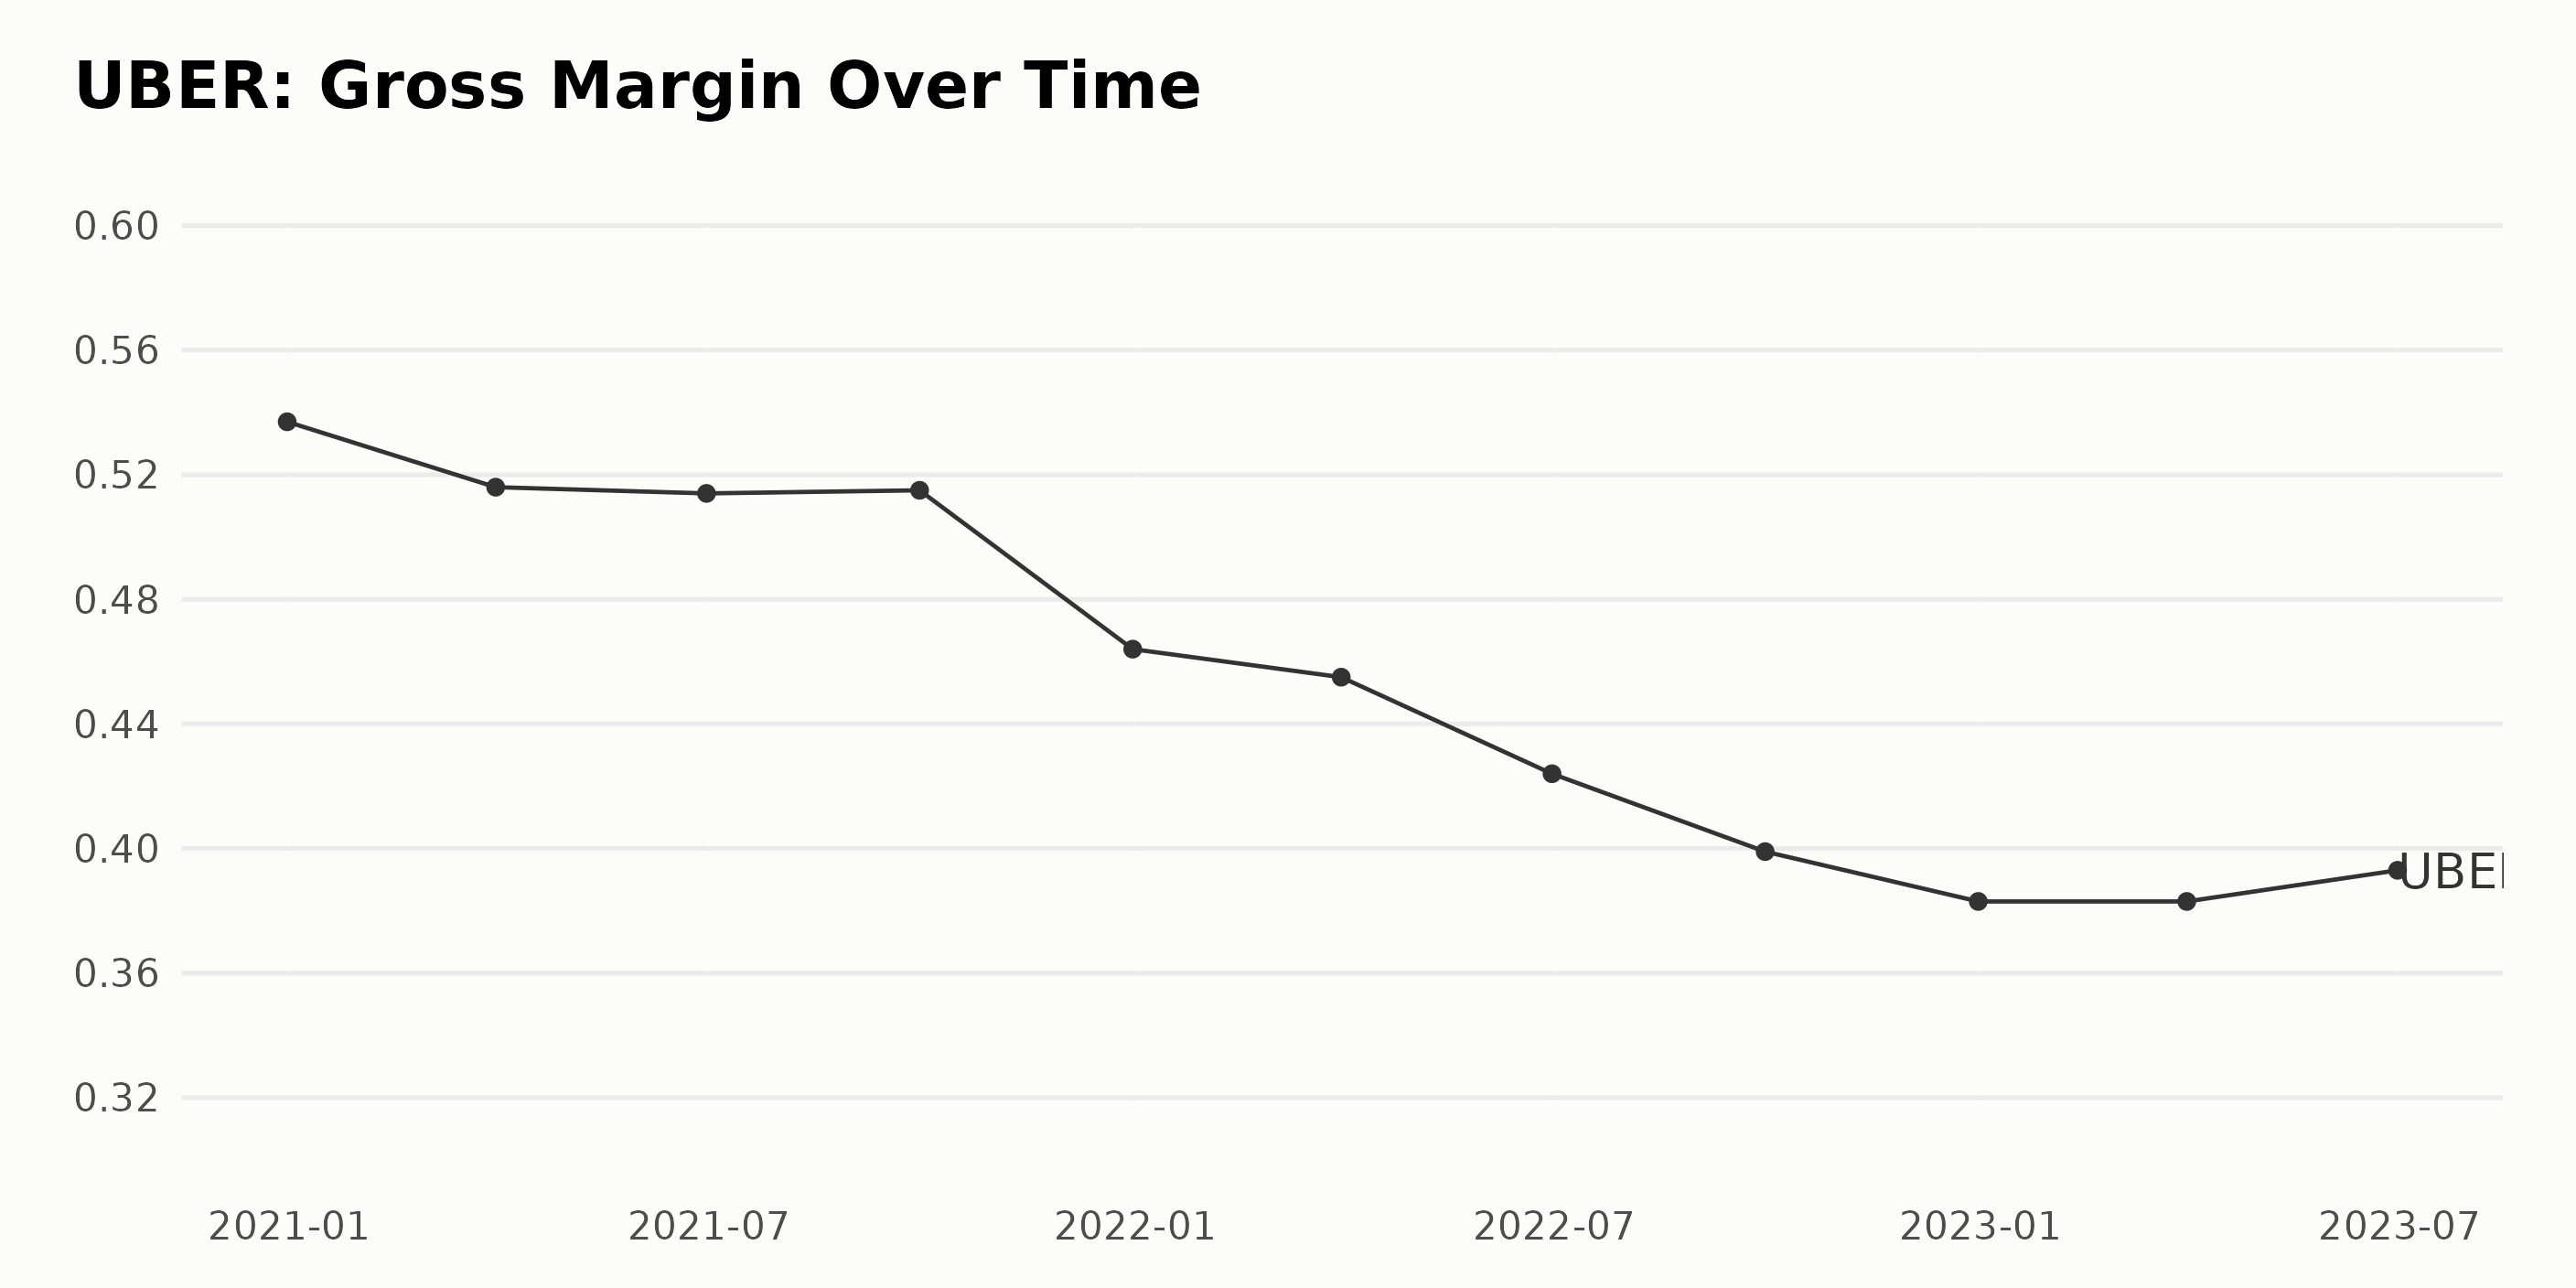
The gross margin of UBER has revealed a decreasing trend from December 2020 to December 2022, followed by a plateau and then a slight increase in the first half of 2023. Interestingly, this downturn is encompassing about two years marked by somewhat constant fluctuations.
- In December 2020, UBER's gross margin stood at 53.70%.
- Subsequent quarters in 2021 witnessed a marginal dip with the following percentages: 51.60% in March, 51.40% in June, and 51.50% in September.
- However, a significant drop occurred by December 2021 to reach 46.40%.
- In the year 2022, this downward trend further accelerated. The gross margin reduced to 45.50% by March, 42.40% by June, and 39.90% by September, reaching its lowest at 38.30% in December 2022.
- The first quarter of 2023 saw the gross margin stagnating at 38.30%, stopping its previous consistent decline.
- The second quarter marked a slight improvement, with gross margin inching up to 39.30%.
Capturing the overall growth rate in this duration from the first value in December 2020 to the last one in June 2023, there is a negative growth rate of approximately 26.82%. The most remarkable takeaway, however, is the continued decrease in gross margin from 53.70% to the lowest point of 38.30% before showing signs of recovery in June 2023.
Hence, it would be prudent to keep a lookout for future trends and data to anticipate whether this recovery continues or if it was simply a temporary uptick.
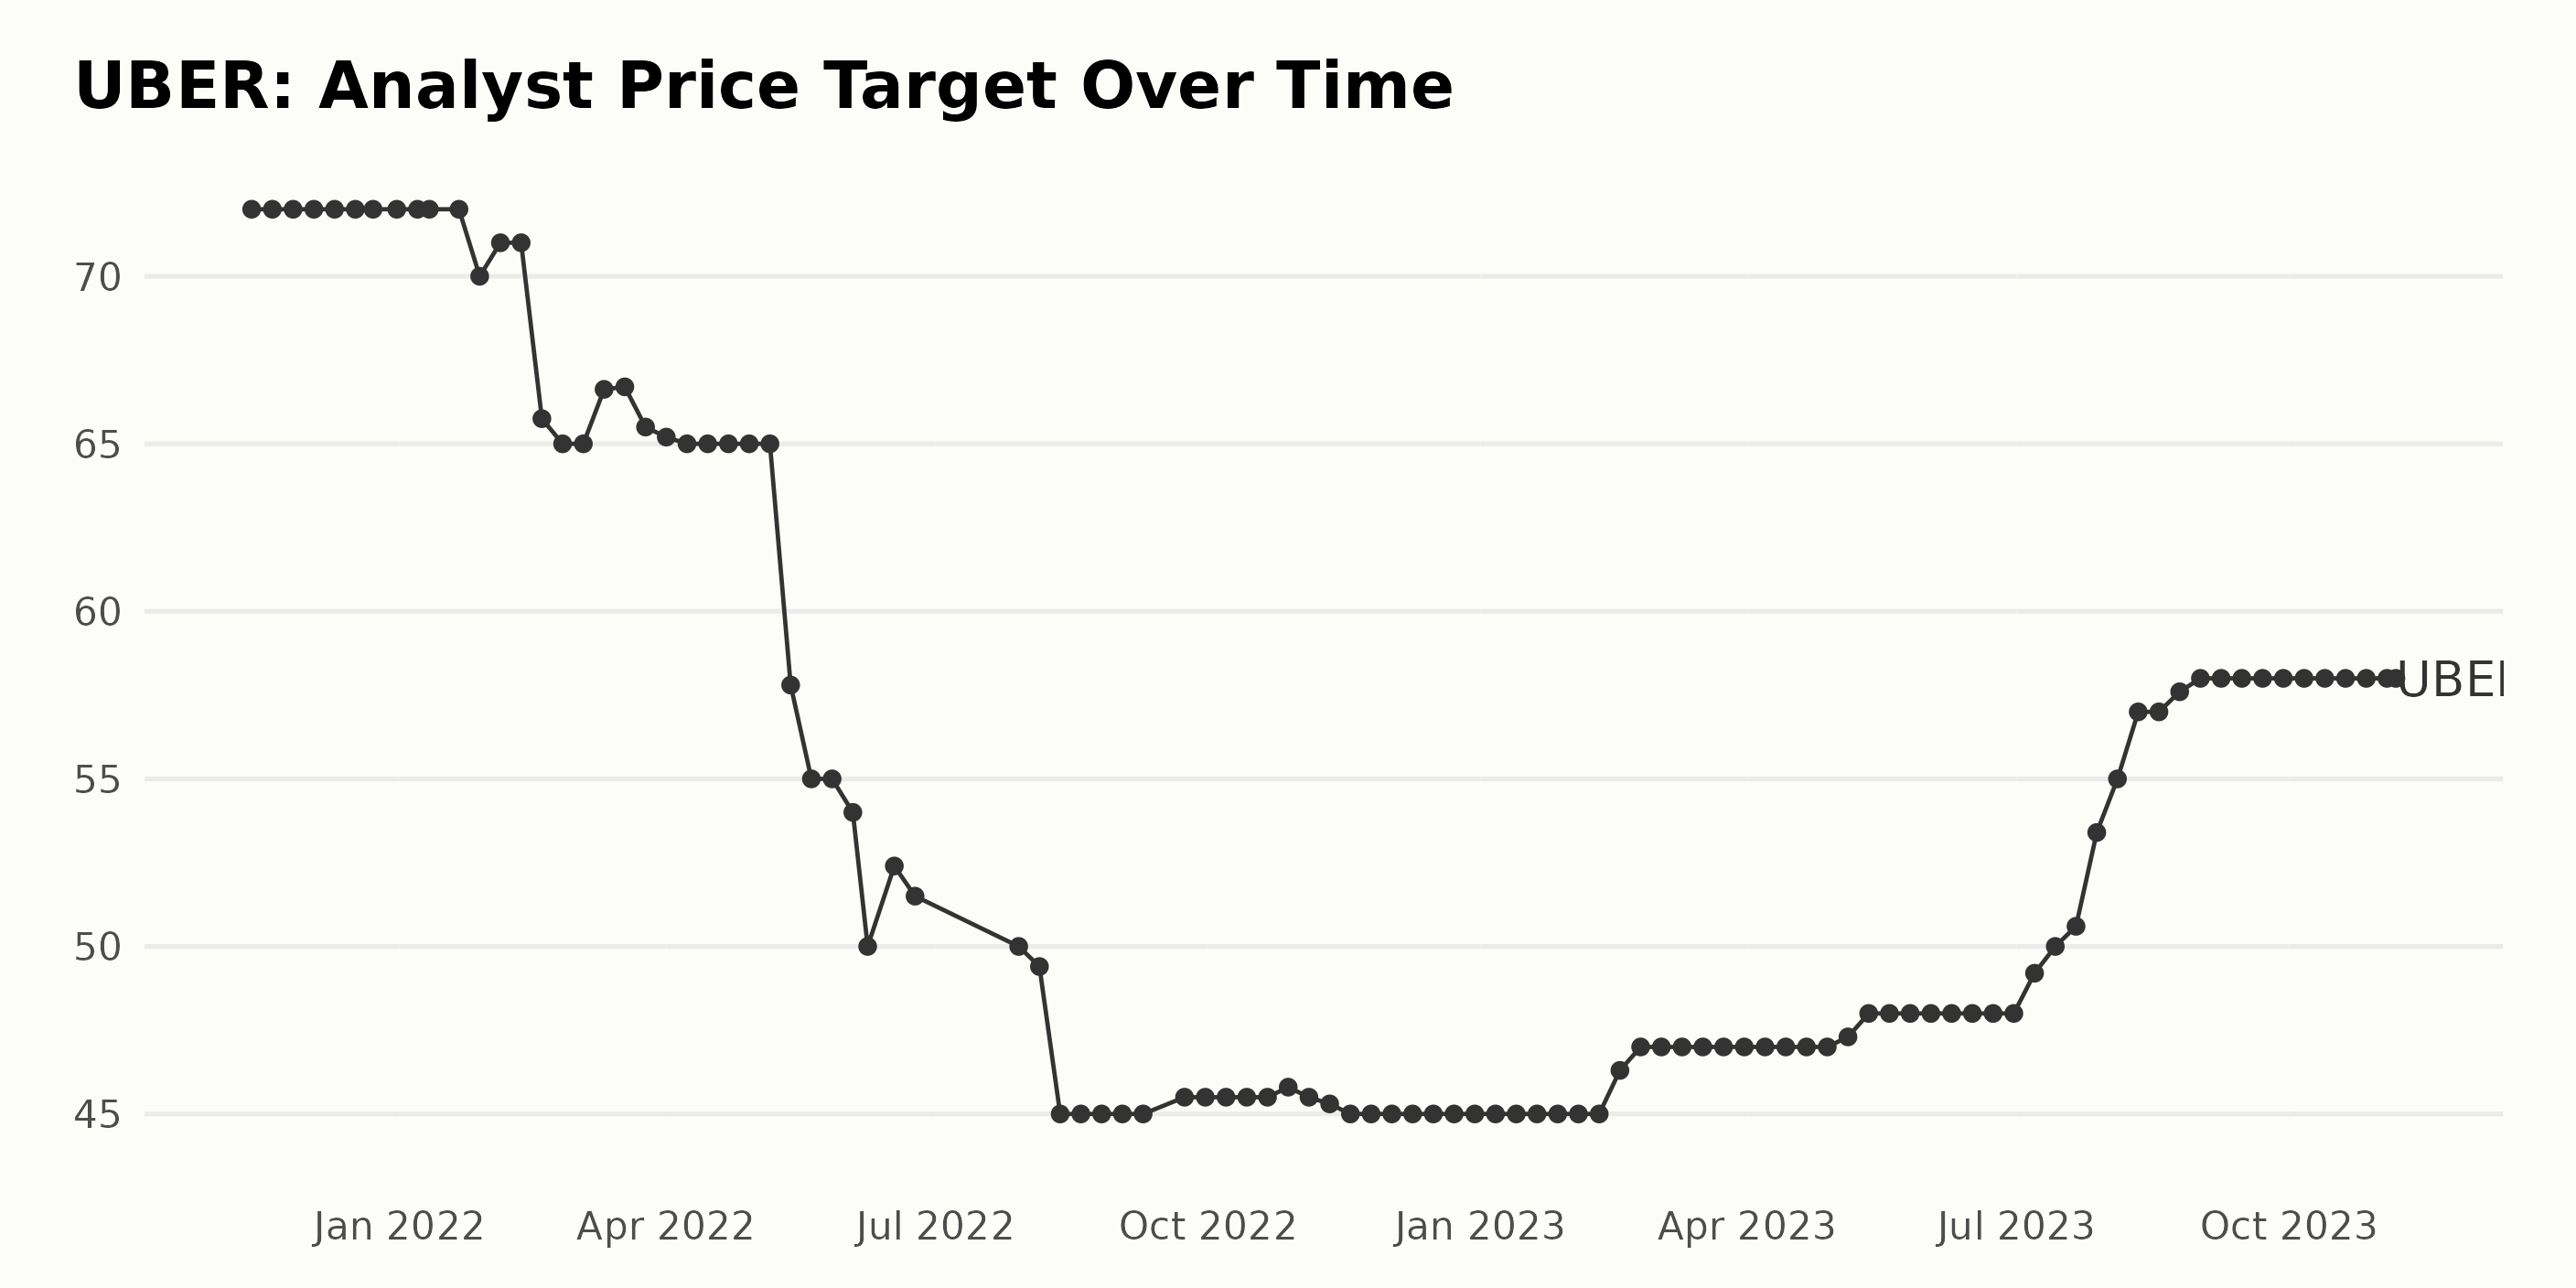
The Analyst Price Target (APT) for UBER showed a declining trend starting from November 2021 to August 2022. The APT remained constant at $72 from November 12, 2021, to January 21, 2022. However, the APT began to drop progressively from $70 on January 28, 2022, to a low of $45 by August 12, 2022.
This APT of $45 persisted until February 17, 2023. In the latter half of February 2023, the APT saw a slight rise in value to $46.3 and then to $47 by February 24, 2023. The price target then held steady at 47 until early May 2023.
Further fluctuations in the APT were seen from May to July, but the most notable increase commenced on July 7, 2023, when it recorded an APT of $49.2. The APT continued to climb, reaching a peak of $57.6 on August 25, 2023.
Hereafter, the APT stayed relatively stable with only minor fluctuations, hovering around $58 from September 1, 2023, through to the last data point on November 6, 2023.
Looking at the growth rate, there's a noticeable downtrend followed by a gradual recovery phase. Starting at $72, the APT decreased by approximately 38.89% to reach $45. However, it slowly recovered by nearly 28.89% to reach back up to $58.
Analyzing UBER's Share Price Fluctuations from May to November 2023
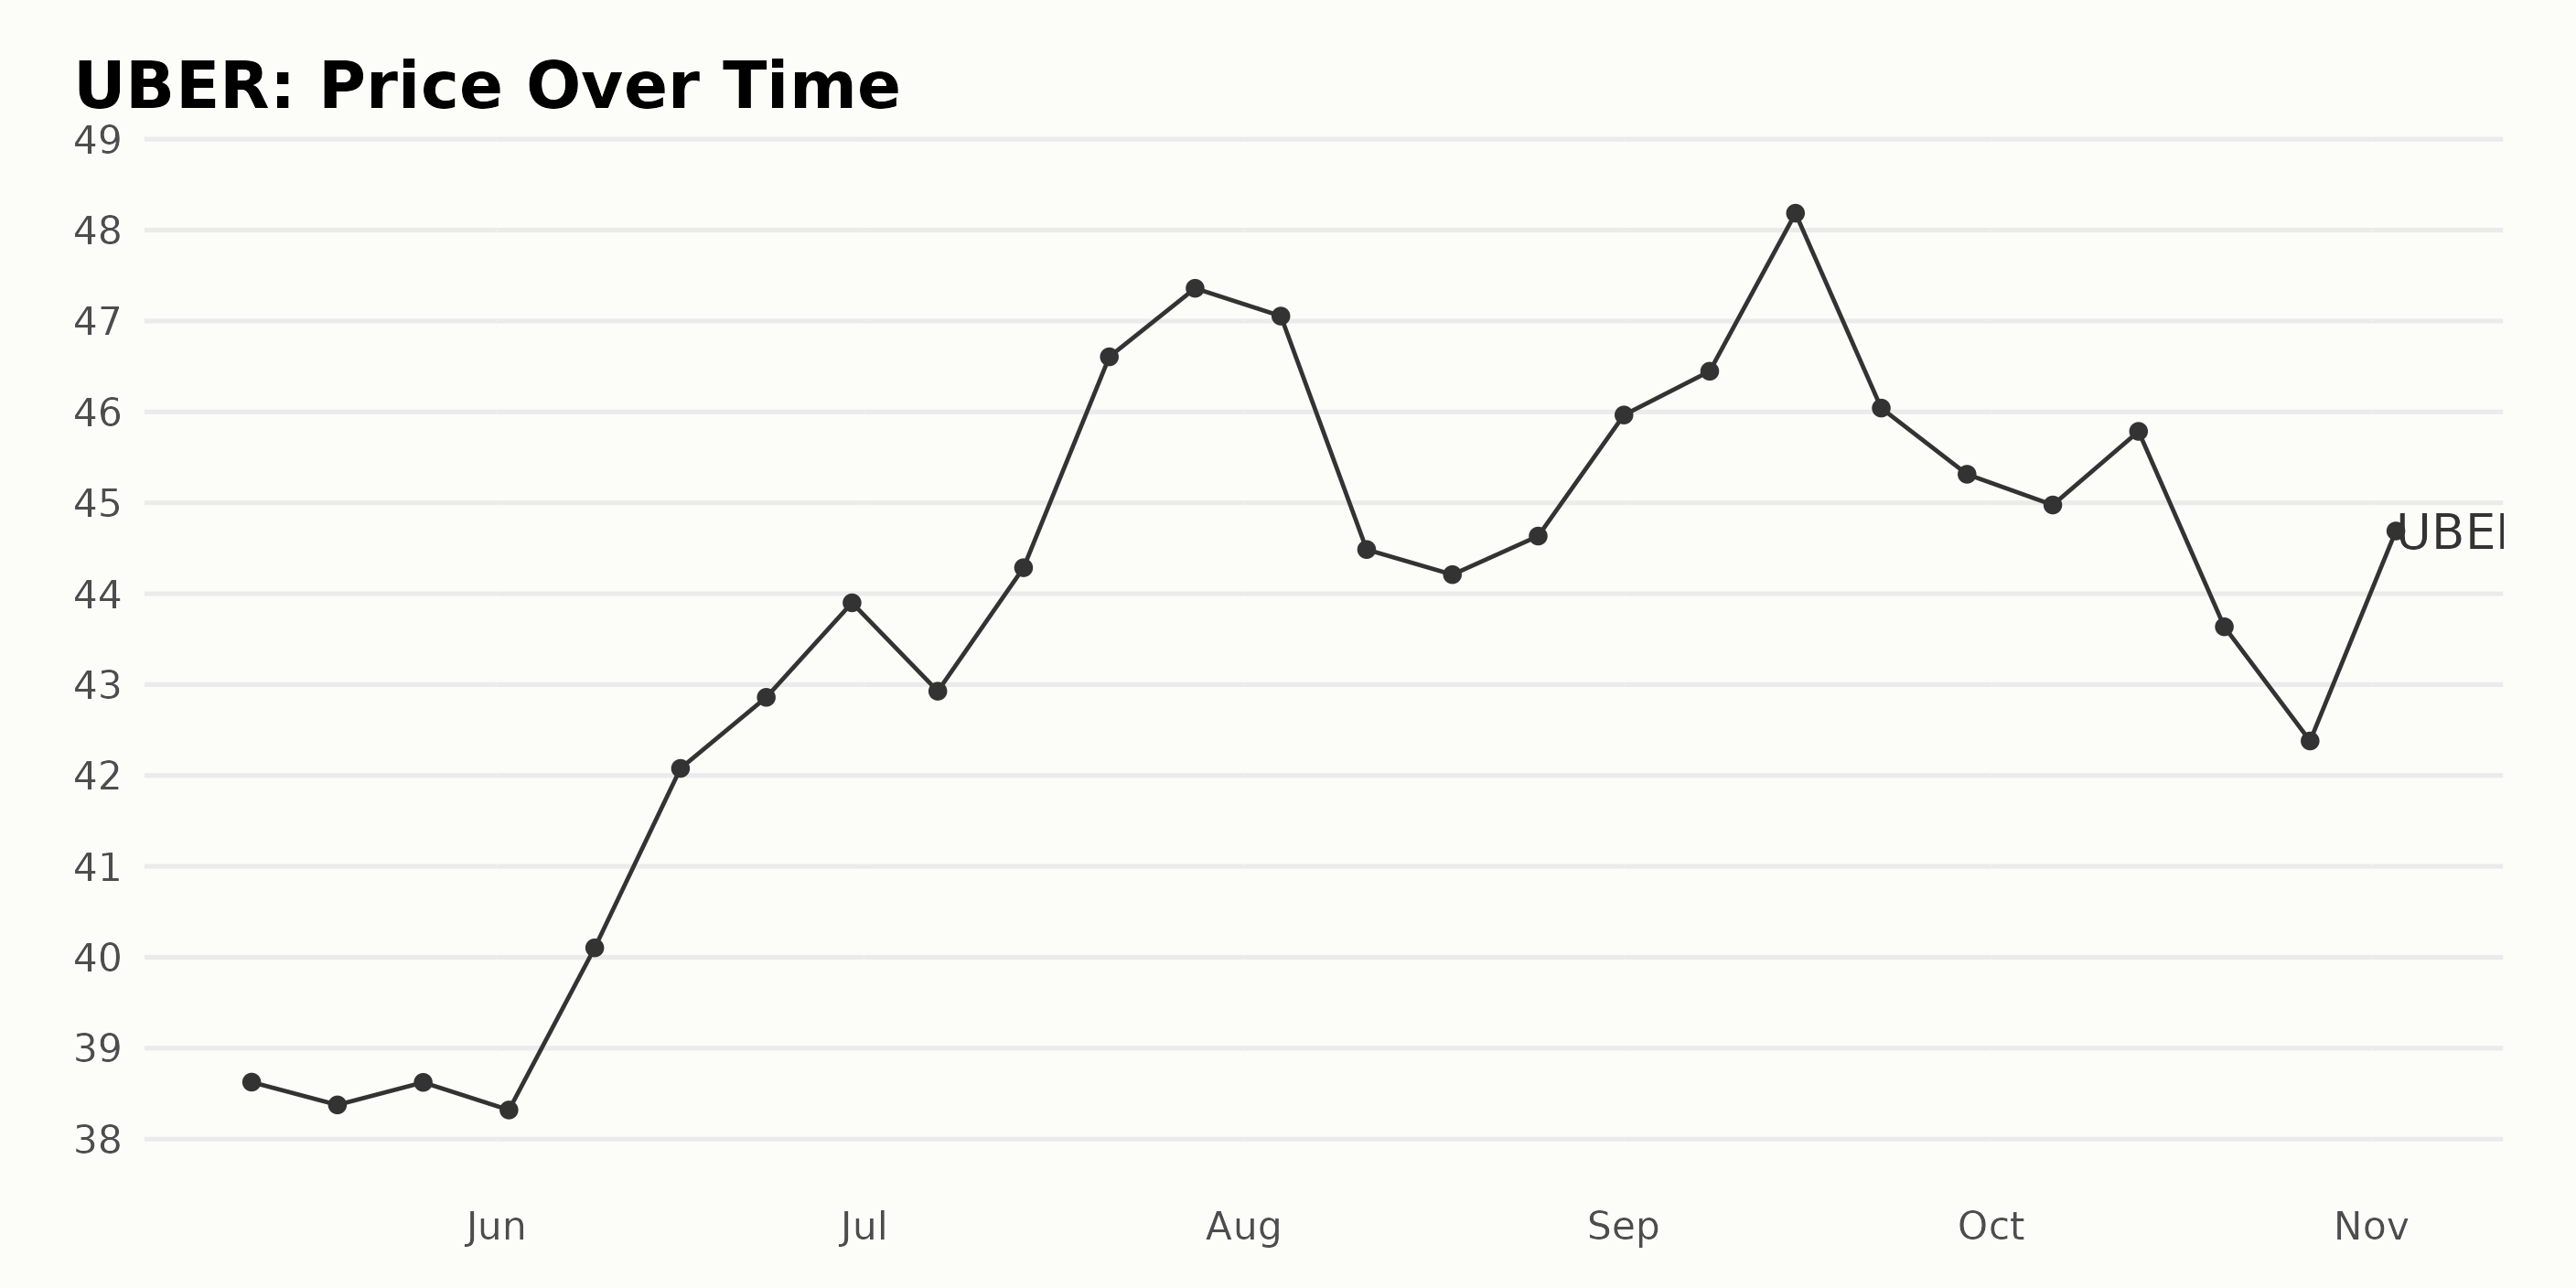
The data provided shows the share price of UBER from May 12, 2023, to November 3, 2023. Here's a description of the trend and growth rate of UBER's share price during this period:
- The share price of UBER on May 12, 2023 was $38.63.
- After some fluctuations in the following weeks, there was a consistent rise in UBER's share price from June 2, 2023, at $38.32, to June 30, 2023, at $43.9. This represents a 14.56% increase.
- Following this growth, the share price saw a slight drop to $42.93 on July 7, 2023, but then it showed an increasing trend until July 28, 2023, when it reached a peak of $47.36.
- After reaching its peak in July, the share price fell to $44.49 in August and surged again to $48.19 in mid-September before decreasing to $45.31 at the end of September. This indicates a volatile behavior in UBER's share price.
- In the month of October 2023, the share price trend was generally declining, where it started at $44.98 on October 6 and ended at $42.38 by October 27.
- Despite the fall in the previous month, UBER's share price rebounded, rising to $47.75 by November 3, 2023.
In conclusion, UBER's share price shows a fluctuating trend with periods of both consistent growth and decline within the observed period from May to November 2023. The overall movement could be described as moderately volatile. Here is a chart of UBER's price over the past 180 days.
Analysis of UBER's Performance: Sentiment, Quality, and Growth Trends
As of the latest data provided, UBER, under the Technology - Services category, has been assigned a POWR Ratings grade of C (Neutral). The data spans from May 13, 2023, to November 4, 2023, during which UBER's POWR grade alternated between C (Neutral) and B (Buy). Key points to note include:
- From May 13 to July 29, 2023, the stock consistently held a C (Neutral) grade with fluctuating rankings within its category, averaging around the mid-30s.
- On August 5, 2023, the POWR grade improved to B (Buy). This continued for over a month, ranging up to September 16, 2023, with the rank enjoying an advance into the early twenties.
- By September 23, 2023, the grade reverted back to C (Neutral). It then briefly returned to B (Buy) on October 7, 2023, before settling back to a consistent C (Neutral) from October 14 to November 6, 2023.
Over this period, UBER’s ranking frequently shifted between #20 and 3#6 among the 73 stocks in the Technology - Services category. By November 6, 2023, despite its C (Neutral) grade, UBER managed to secure a ranking of #32 within its category.
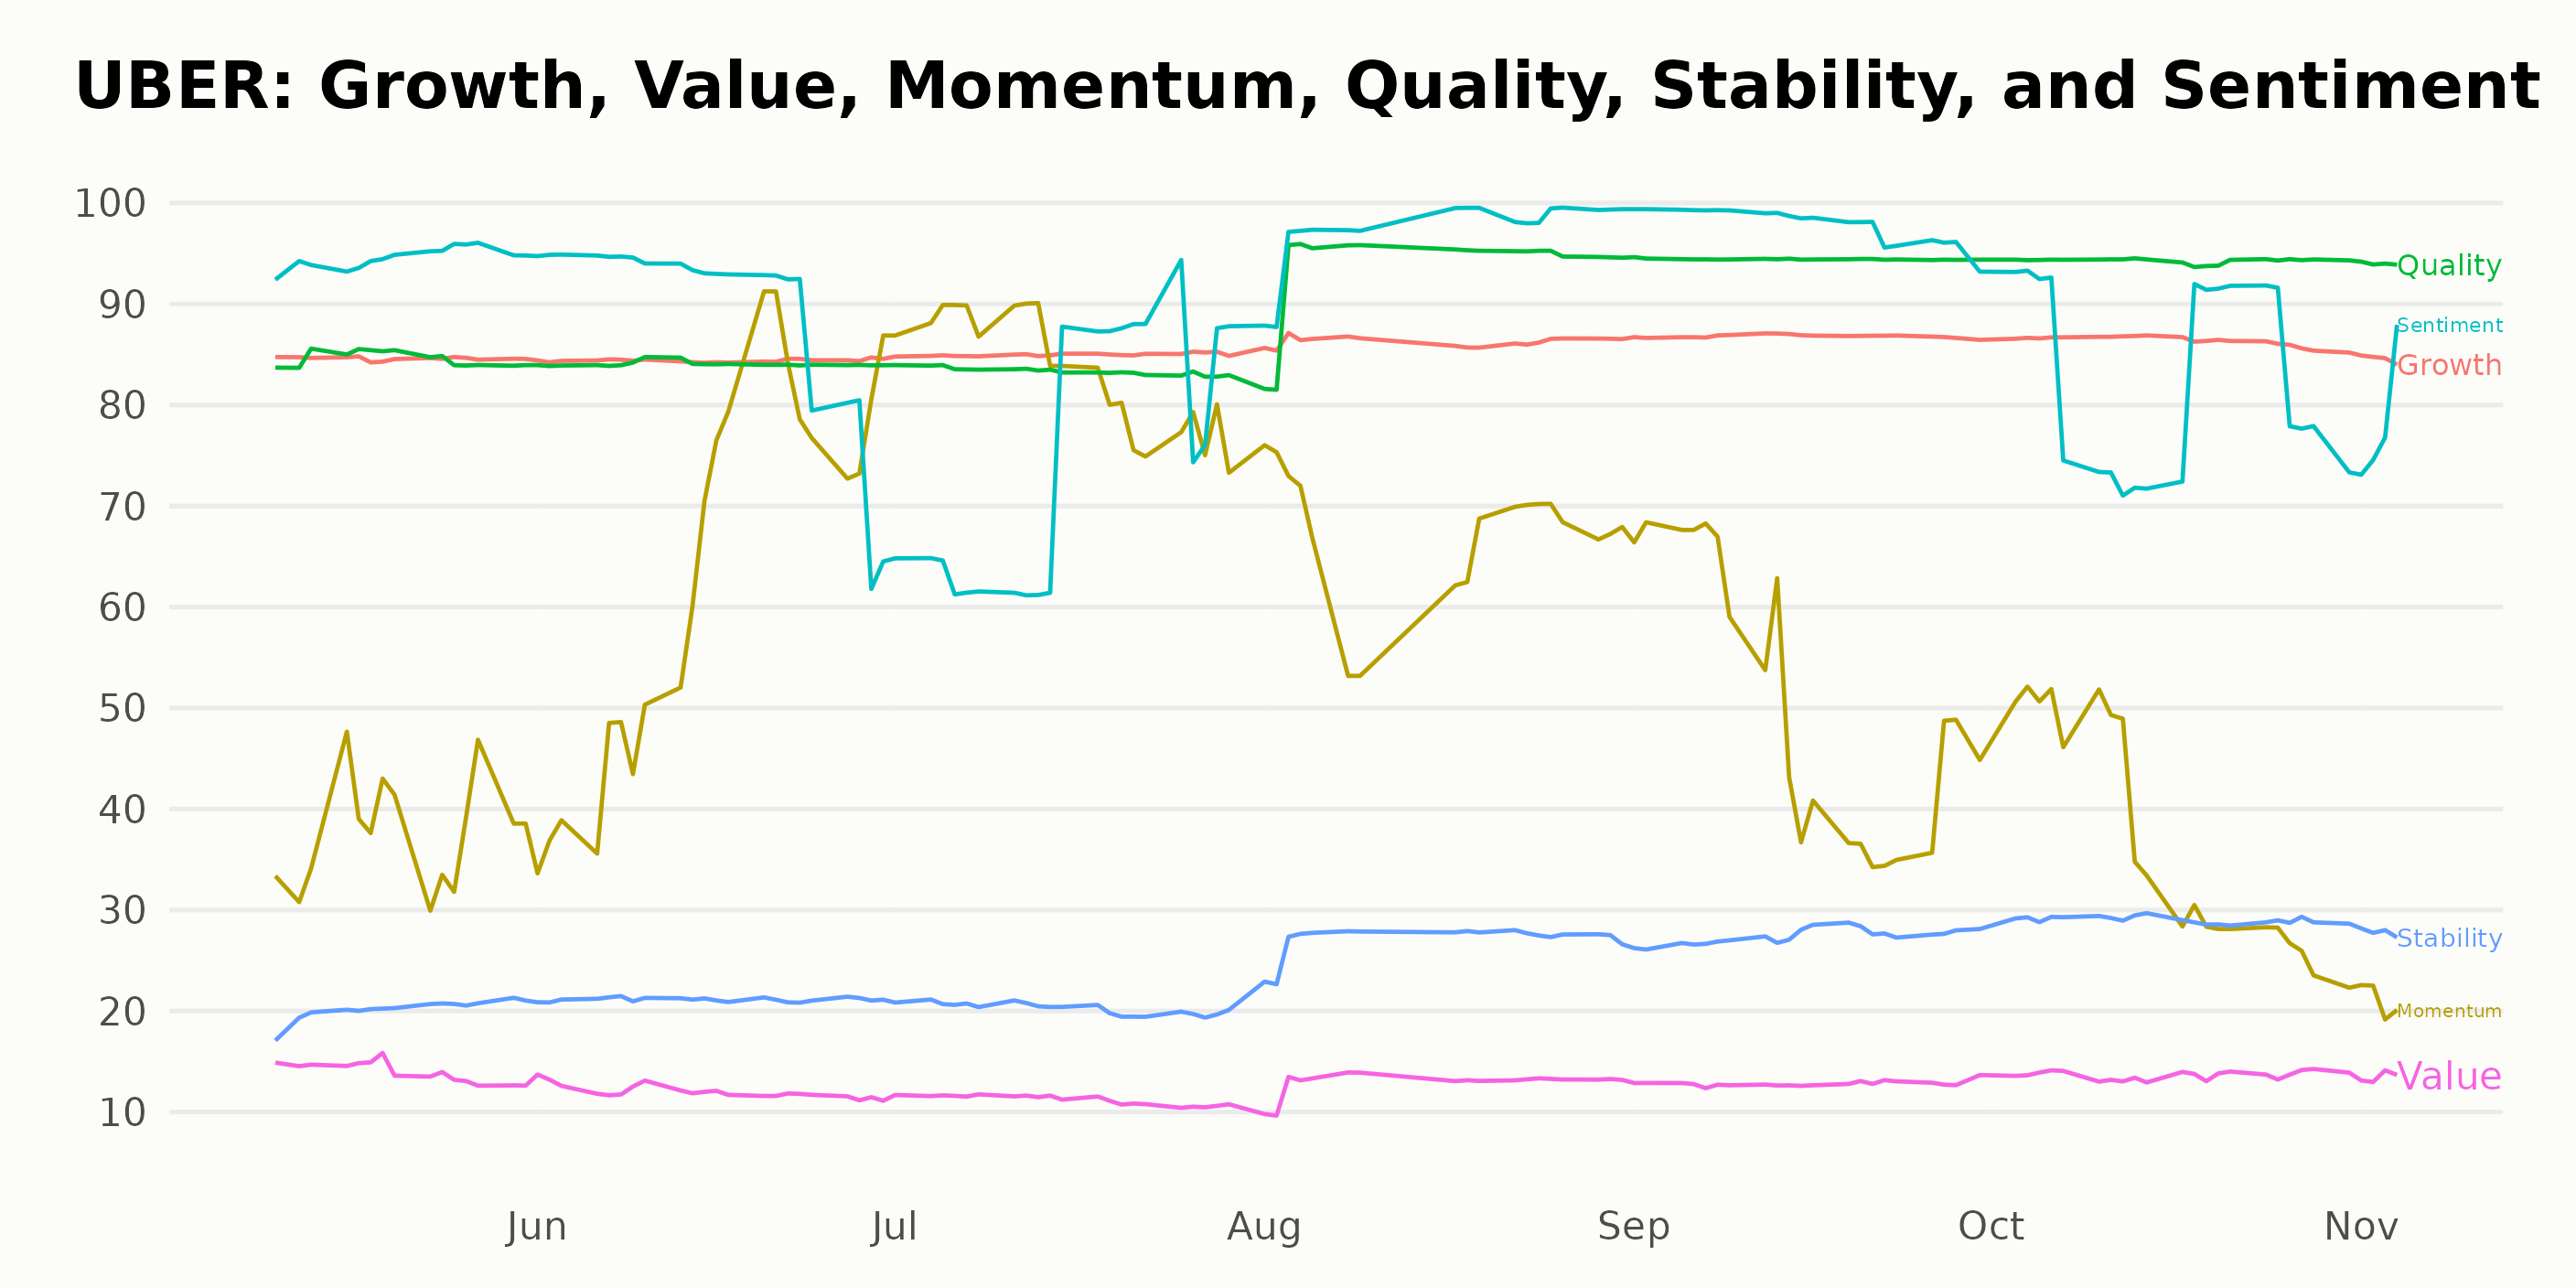
The three most noteworthy dimensions of the POWR Ratings for UBER are Sentiment, Quality, and Growth, as they consistently have the highest ratings.
Sentiment: The Sentiment rating of UBER has shown fluctuations but has been generally high. The score peaked at 98 in September 2023, which is the highest value within the time frame. It started with a value of 95 in May 2023 and ended at 78 on November 4, 2023.
Quality: The Quality score consistently reflected a strong performance. Although it commenced on May 31, 2023, with a value of 85, it exhibited a clear uptrend from August 2023 onwards, maintaining a score of 94 from then on until the end of the considered period.
Growth: UBER's Growth marginally fluctuated over the considered duration but remained fairly high overall. The ratings commenced at 85 in May 2023 and briefly increased to 87 in September 2023, the highest Growth value recorded, before returning to 85 by November 4, 2023.
These trends can give significant insight into the various aspects of UBER's performance over time.
How does Uber Technologies, Inc. (UBER) Stack Up Against its Peers?
Other stocks in the Technology - Services sector that may be worth considering are Serco Group plc (SCGPY), LiveRamp Holdings, Inc. (RAMP), and PC Connection, Inc. (CNXN) - they have better POWR Ratings. Click here to explore more Technology - Services stocks.
What To Do Next?
Get your hands on this special report with 3 low priced companies with tremendous upside potential even in today’s volatile markets:
3 Stocks to DOUBLE This Year >
UBER shares were trading at $47.86 per share on Monday afternoon, up $0.11 (+0.23%). Year-to-date, UBER has gained 93.53%, versus a 14.88% rise in the benchmark S&P 500 index during the same period.
About the Author: Anushka Dutta

Anushka is an analyst whose interest in understanding the impact of broader economic changes on financial markets motivated her to pursue a career in investment research.
The post Uber Technologies (UBER) Earnings Insights - Is the Tech Stock a Buying Opportunity? appeared first on StockNews.com