


In its second-quarter release, Pfizer Inc. (PFE) reported substantial strides in realizing its objective of introducing 19 novel products and indications within 18 months, with eleven launches already accomplished. Throughout 2023, PFE expects to maintain its momentum, achieving pivotal milestones for multiple products.
PFE is also making headway in acquiring Seagen, a global biotech firm specializing in transformative oncology drugs. This move would strengthen PFE's position in the oncology sector, aligning with its short- and long-term financial goals amid the sector's prominent growth in the medical landscape.
However, for the second quarter, the company recorded a 77% year-over-year decline in diluted EPS at $0.41 and a 67% drop in adjusted diluted EPS at $0.67. The 2023 revenue guidance range has also been narrowed to $67 billion - $70 billion, with 6%-8% adjusted 2023 non-COVID operational revenue growth expectations.
In terms of forward non-GAAP P/E, PFE is currently trading at 10.79x, 46.1% lower than the industry average of 20.02x. Its forward EV/EBITDA of 3.29x is 8.4% lower than the 3.59x industry average. Moreover, the stock’s forward EV/EBITDA of 8.89x compares to the 13.63x industry average.
Given this backdrop, let’s look at the trends of PFE’s key financial metrics to understand why it could be wise to wait for a better entry point in the stock.
Analyzing Pfizer Inc.'s Financial Performance: Net Income Growth and Fluctuations in Key Ratios from 2020-2023
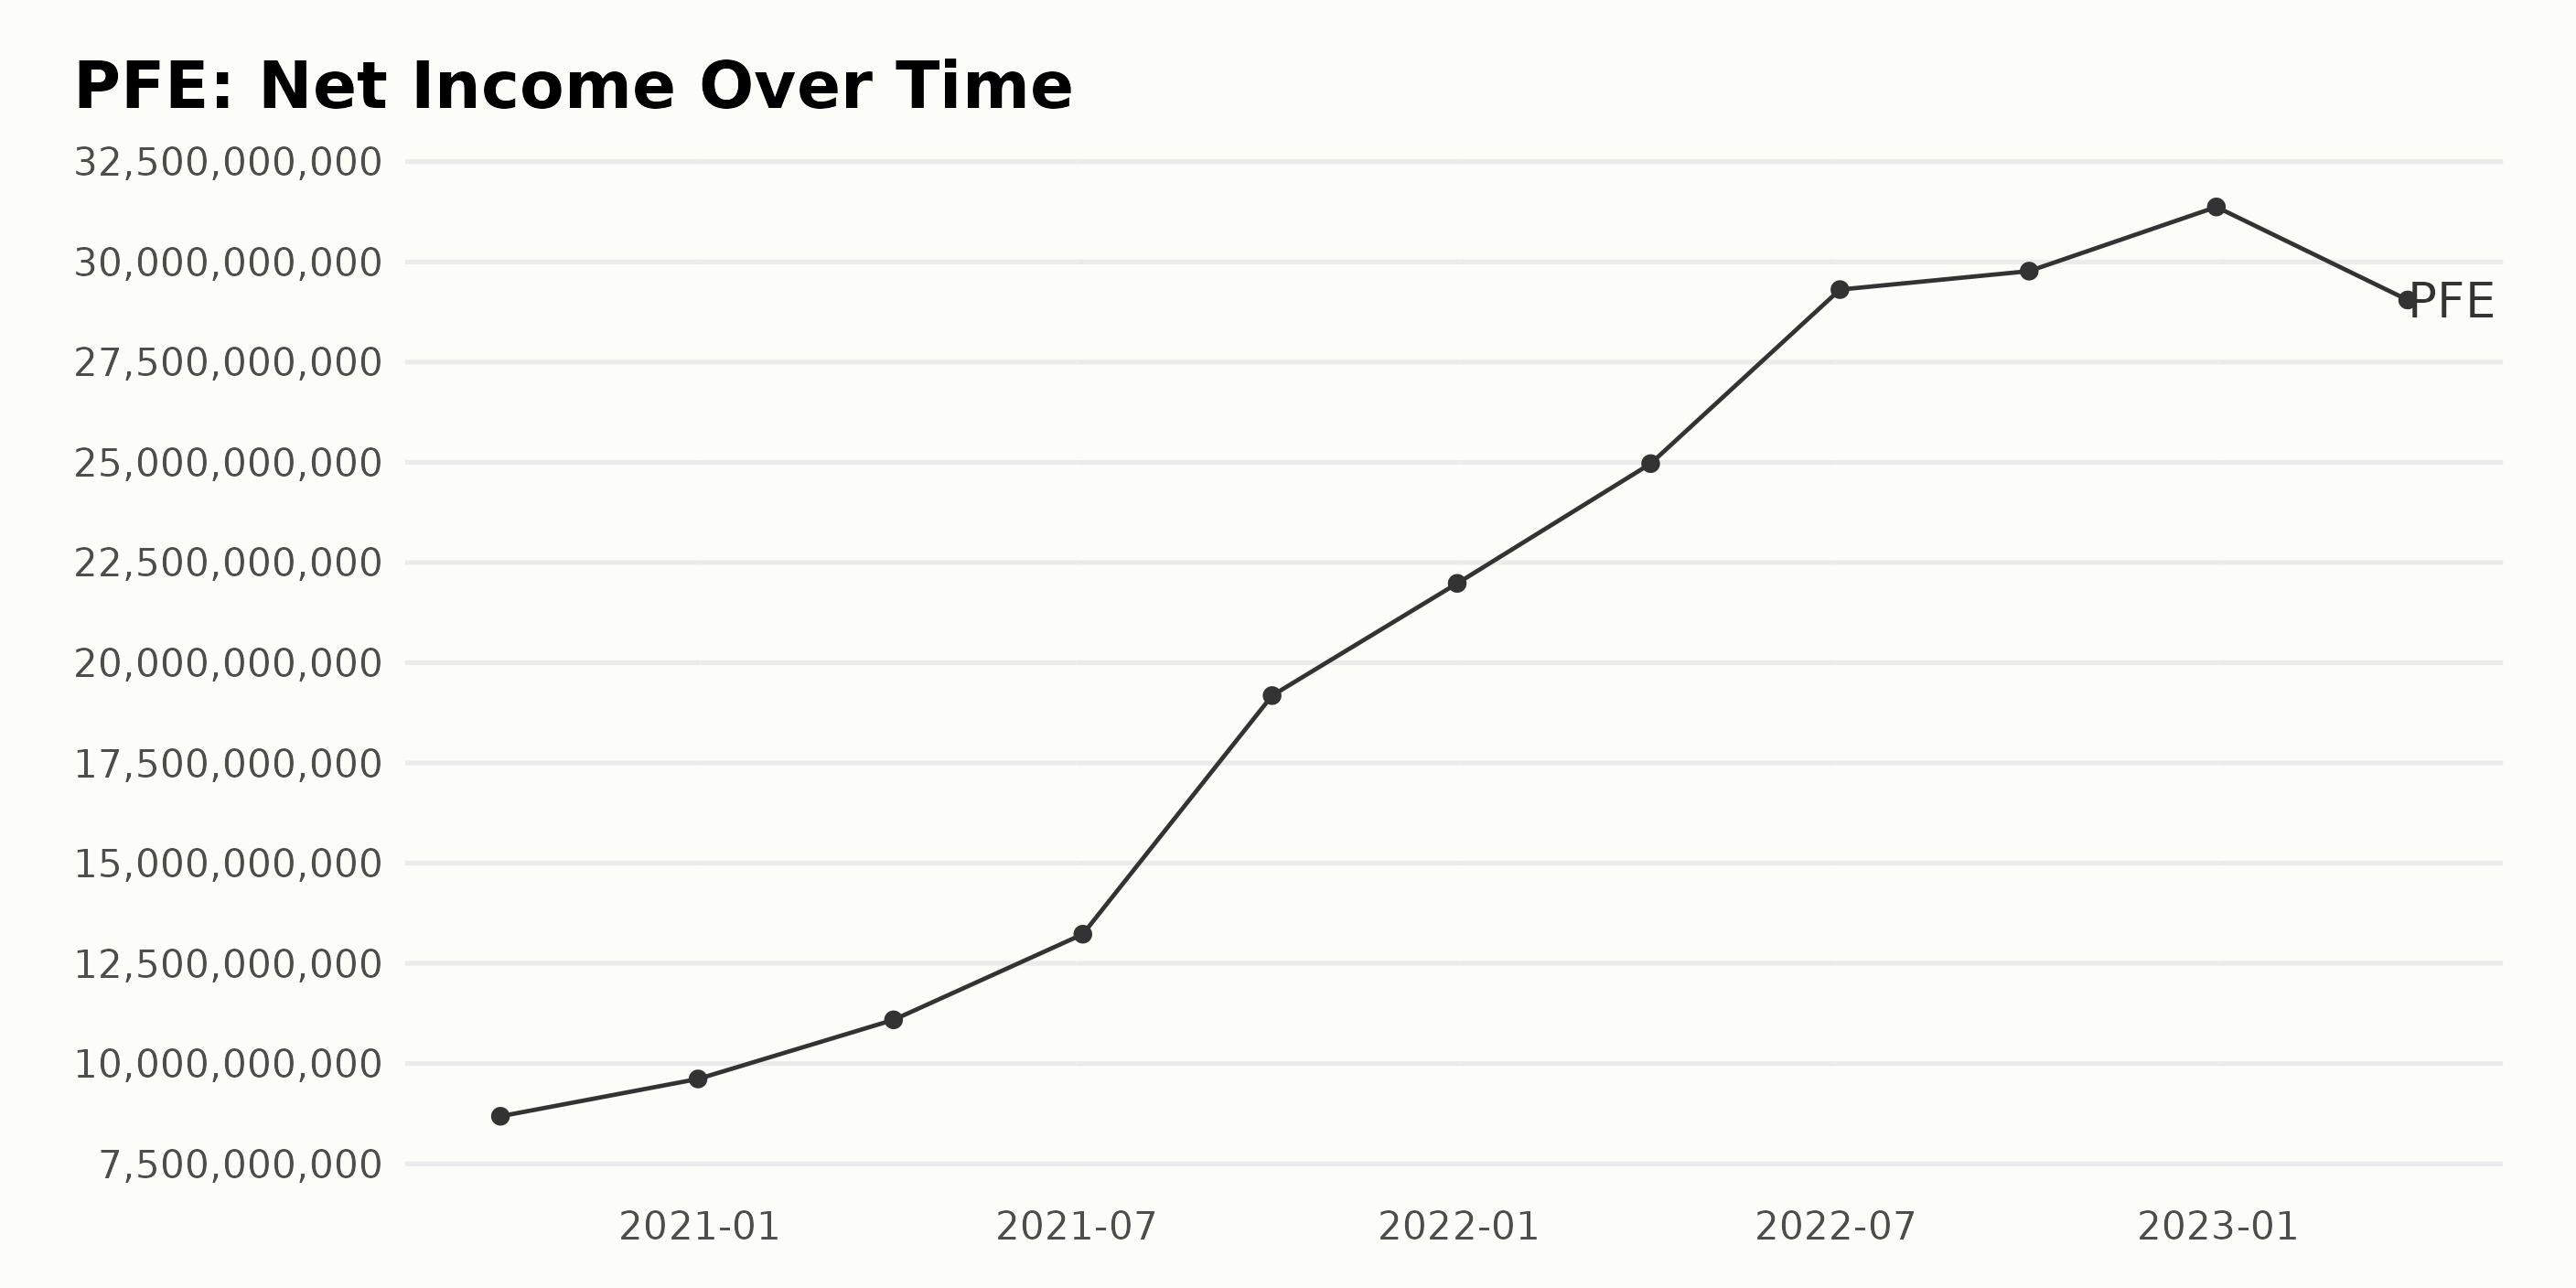
The trailing-12-month net income of PFE over the reporting period shows a generally increasing trend, with some fluctuations. Key points include:
- The net income began at $8.68 billion in September 2020.
- Initially, there was a steady increase in net income to $19.18 billion by October 2021.
- The largest growth occurred between July 2022 and October 2022, with the net income rising from $29.31 billion to $31.37 billion.
- However, there was a significant decline in net income to $29.05 billion in April 2023.
Between the start of the series in September 2020 and the end in April 2023, the net income increased by approximately 235% despite the fluctuations.
Most notably, the net income of PFE reached its peak at the end of December 2022 at $31.37 billion before experiencing a downturn in the next quarter. This decrease marks an apparent deviation from the preceding upward trend.
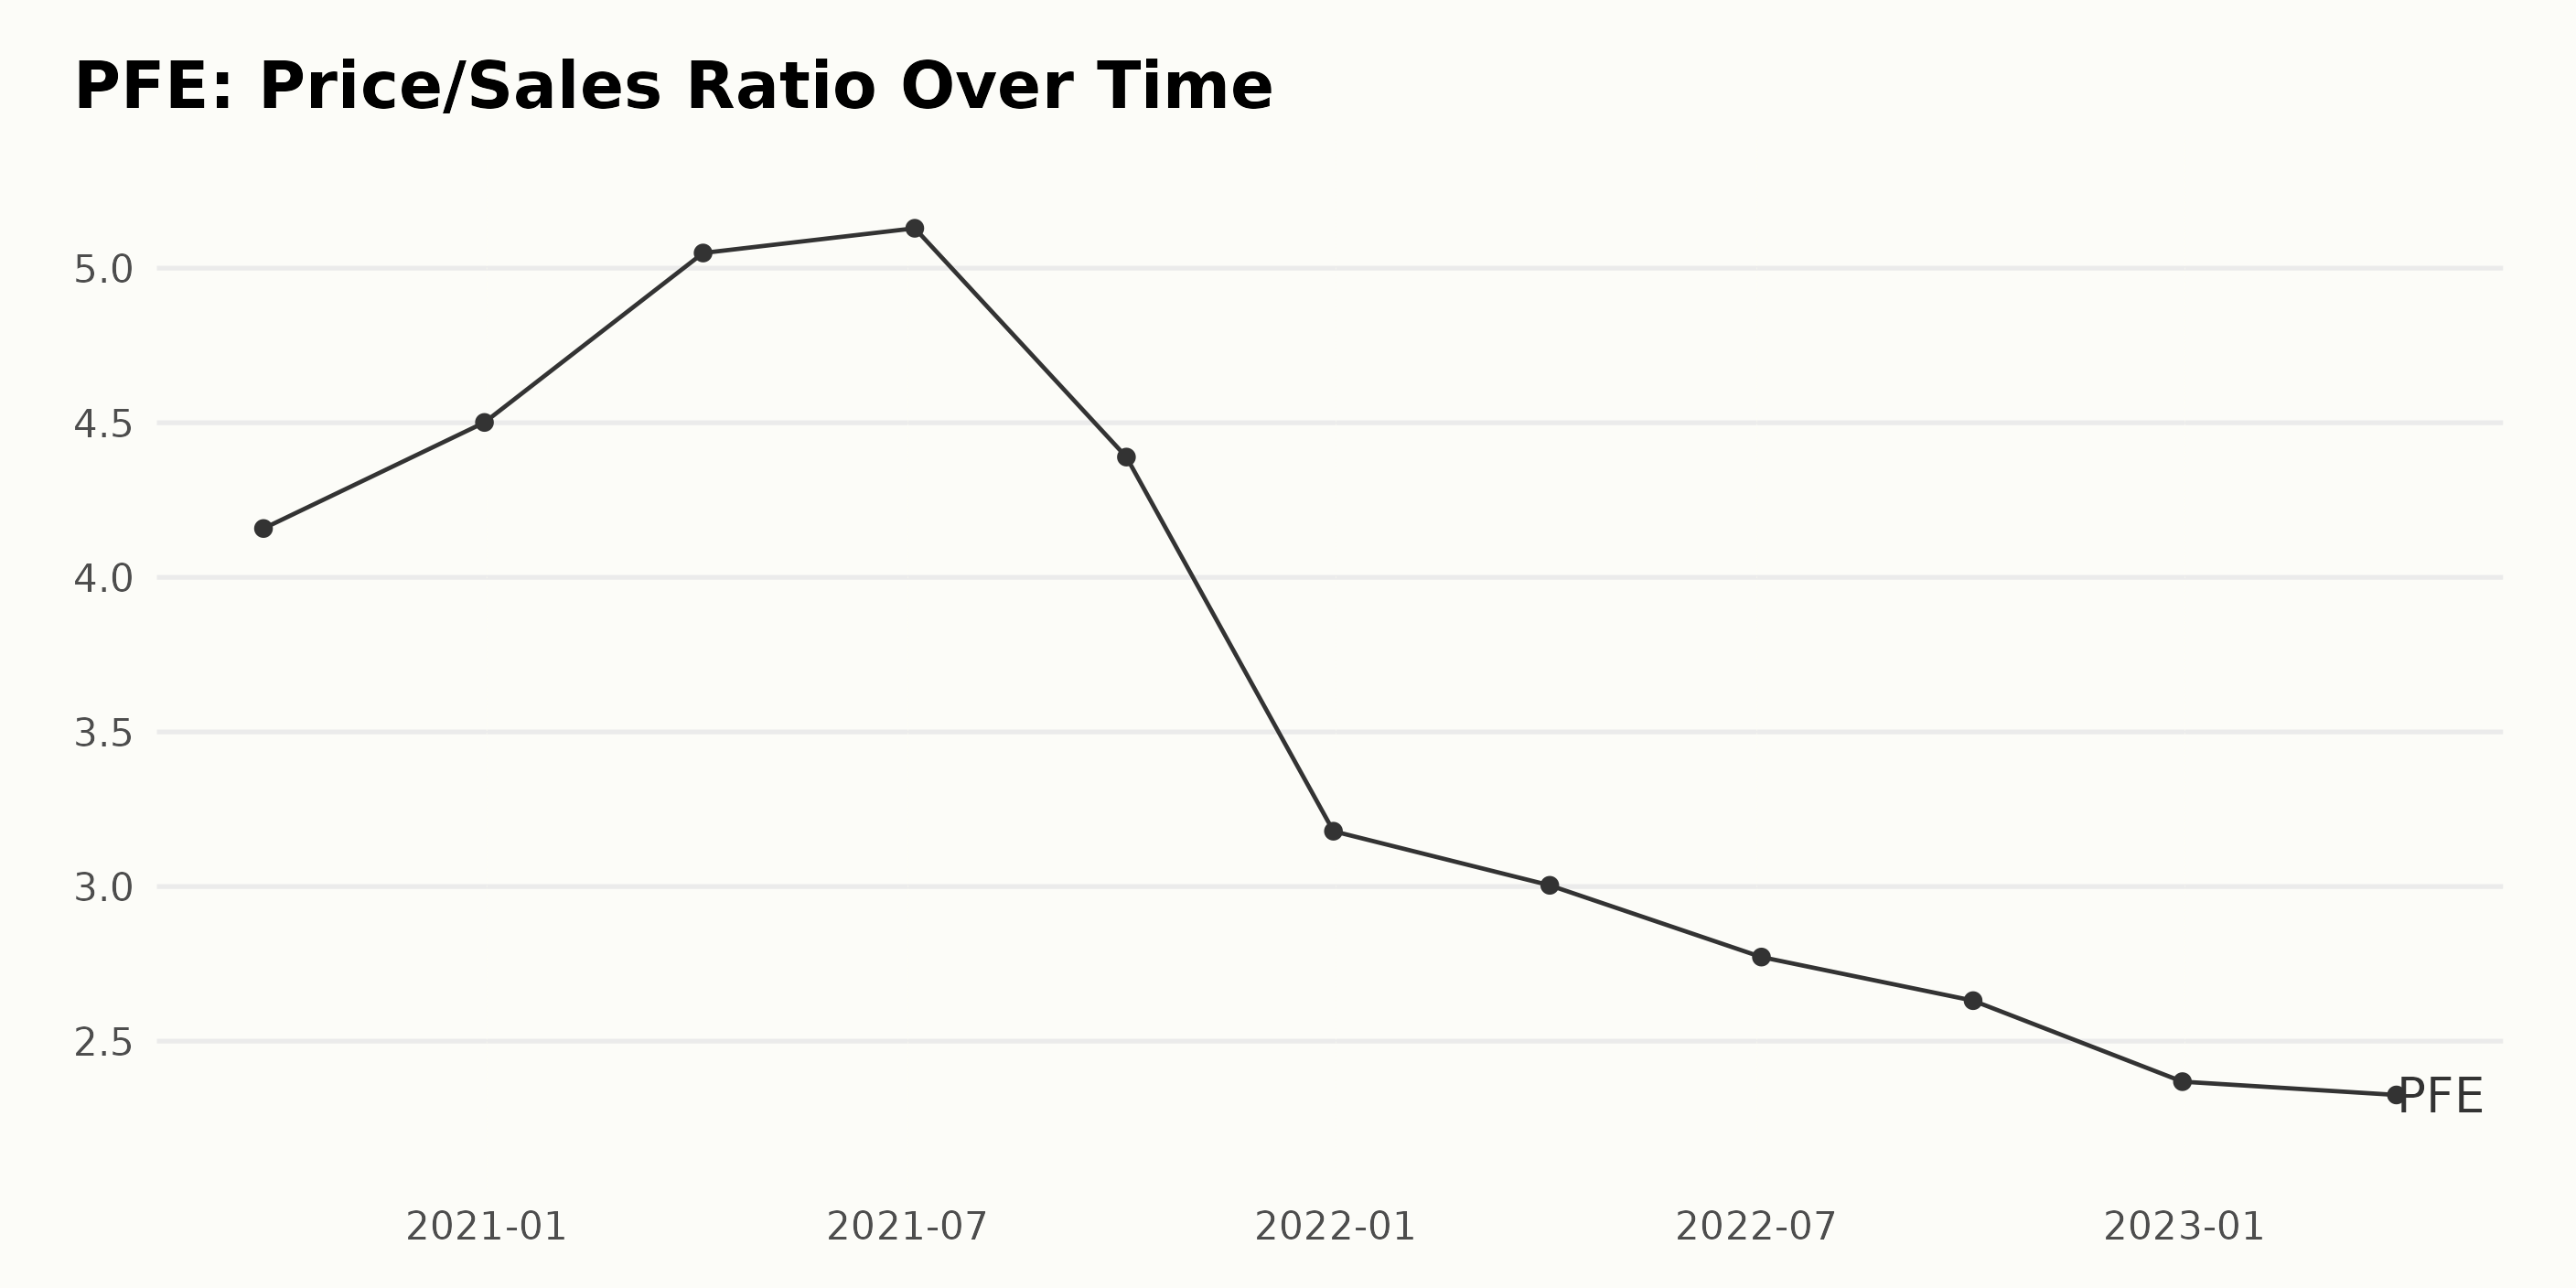
The data series reveals the Price/Sales ratio fluctuation for PFE between September 2020 and April 2023.
- In September 2020, PFE had a Price/Sales ratio of 4.16.
- In December 2020, the Price/Sales ratio increased to 4.50.
- In April 2021, there was significant growth, with the Price/Sales ratio reaching 5.05.
- By July 2021, a slight increment was observed with a Price/Sales ratio of 5.13.
- By October 2021, the Price/Sales ratio had decreased significantly to 4.39.
- By the end of December 2021, it plummeted further to 3.18.
- The following year, in April 2022, the Price/Sales ratio was slightly lower at 3.00.
- By July 2022, the downward trend continued, with the Price/Sales at 2.77.
- In October 2022, a slight decrease occurred, leaving the Price/Sales at 2.63.
- Closing the year in December 2022 at a low of 2.37.
- The last observation made in April 2023 shows little change, with the ratio at 2.33.
The data illustrates a robust uptrend from September 2020 through July 2021, then a noticeable downtrend through April 2023. Notably, the most drastic fluctuations were seen between April 2021 and October 2021 and again from December 2021 through July 2022.
The P/S ratio's overall growth rate from September 2020 to April 2023 is negative, suggesting a decrease in value. This report particularly underscored the most recent data, namely, the last value, which is 2.33 (April 2023).
Compared to the first recorded value of 4.16 (September 2020), it represents a significant decline over time. This indicates that the sales rate has consistently outpaced the price, which might suggest an undervalued state for PFE in terms of its Price/Sales ratio.
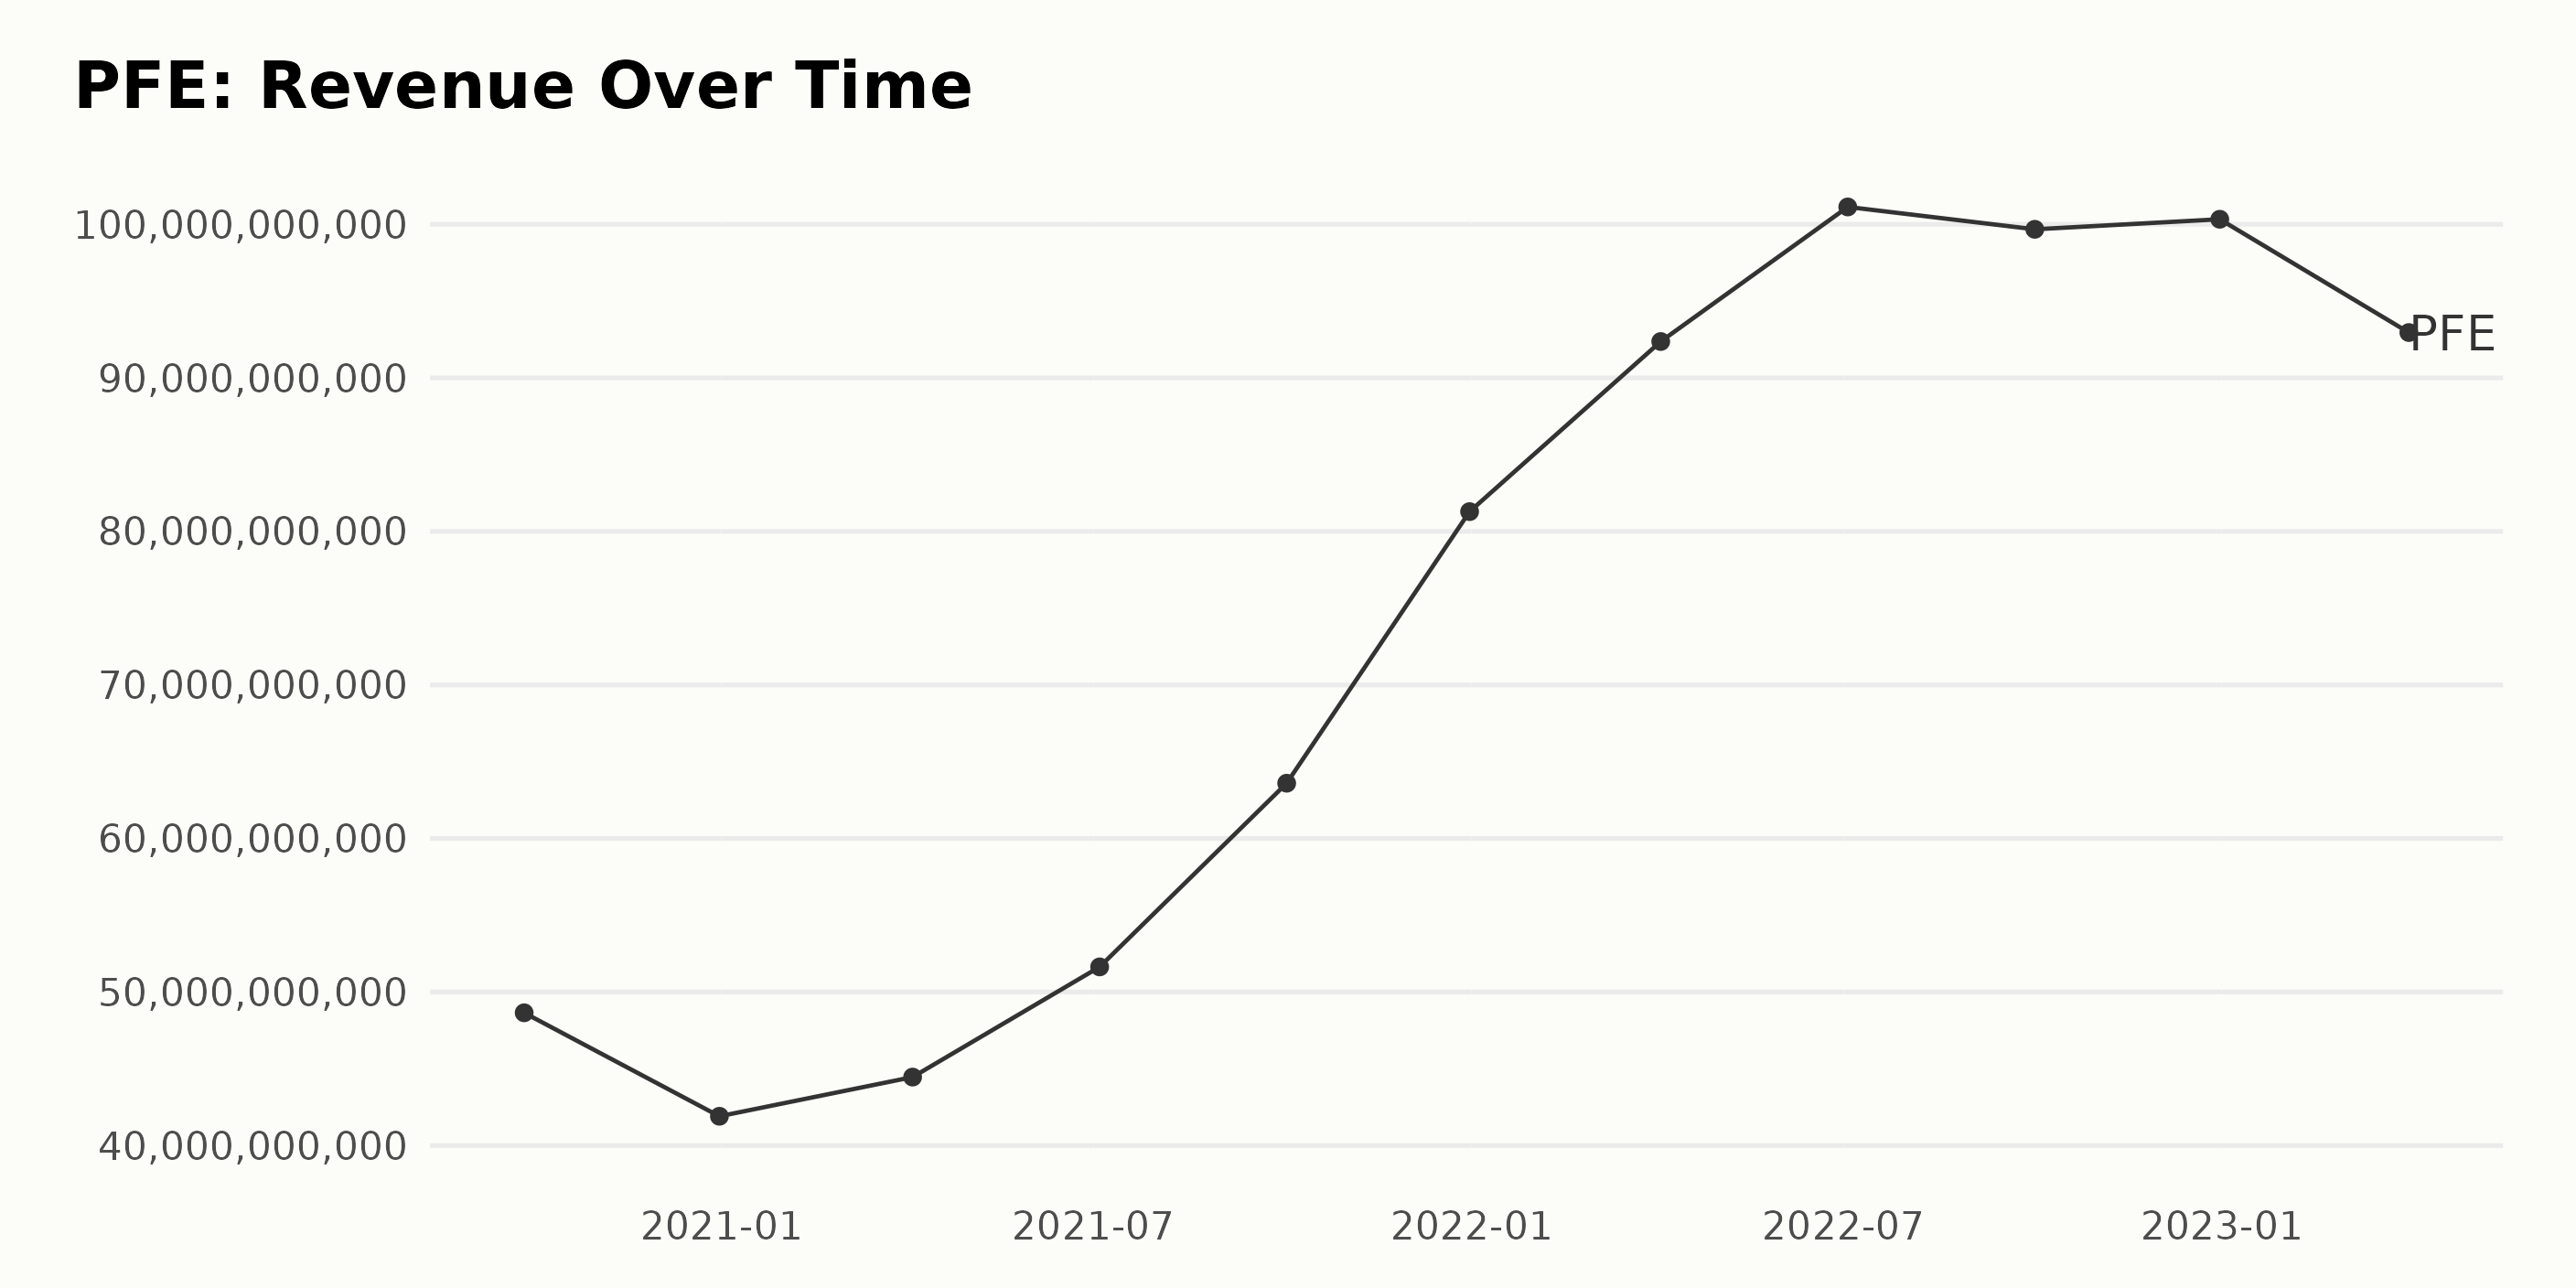
The data series shows the trailing-12-month revenue trend of PFE over a period spanning from September 2020 to April 2023.
- As of September 2020, PFE’s revenue was $48.65 billion.
- In December 2020, a decline to $41.91 billion was reported, which represents a drop from the previous quarter.
- From there, an upward trajectory began, starting with $44.46 billion in April 2021, $51.64 billion in July 2021, and a notable jump to $63.6 billion in October 2021.
- December 2021 marked another milestone as revenue surged to $81.29 billion. The upward trend continued through the first half of 2022, peaking at $101.13 billion in July 2022.
- An unexpected downturn occurred in October 2022, where revenue dropped to $99.68 billion and slightly bounced back to $100.33 billion by the end of December 2022.
- The most recent data point in April 2023 shows a significant drop again in revenue to $92.95 billion.
In summary, there was a general upward trend in PFE’s revenue from September 2020 through the middle of 2022, followed by fluctuations towards the end of 2022 and a decline in early 2023. The revenue growth rate, measuring the first value ($48.65 billion in September 2020) to the last ($92.95 billion in April 2023), is around 90.97%.
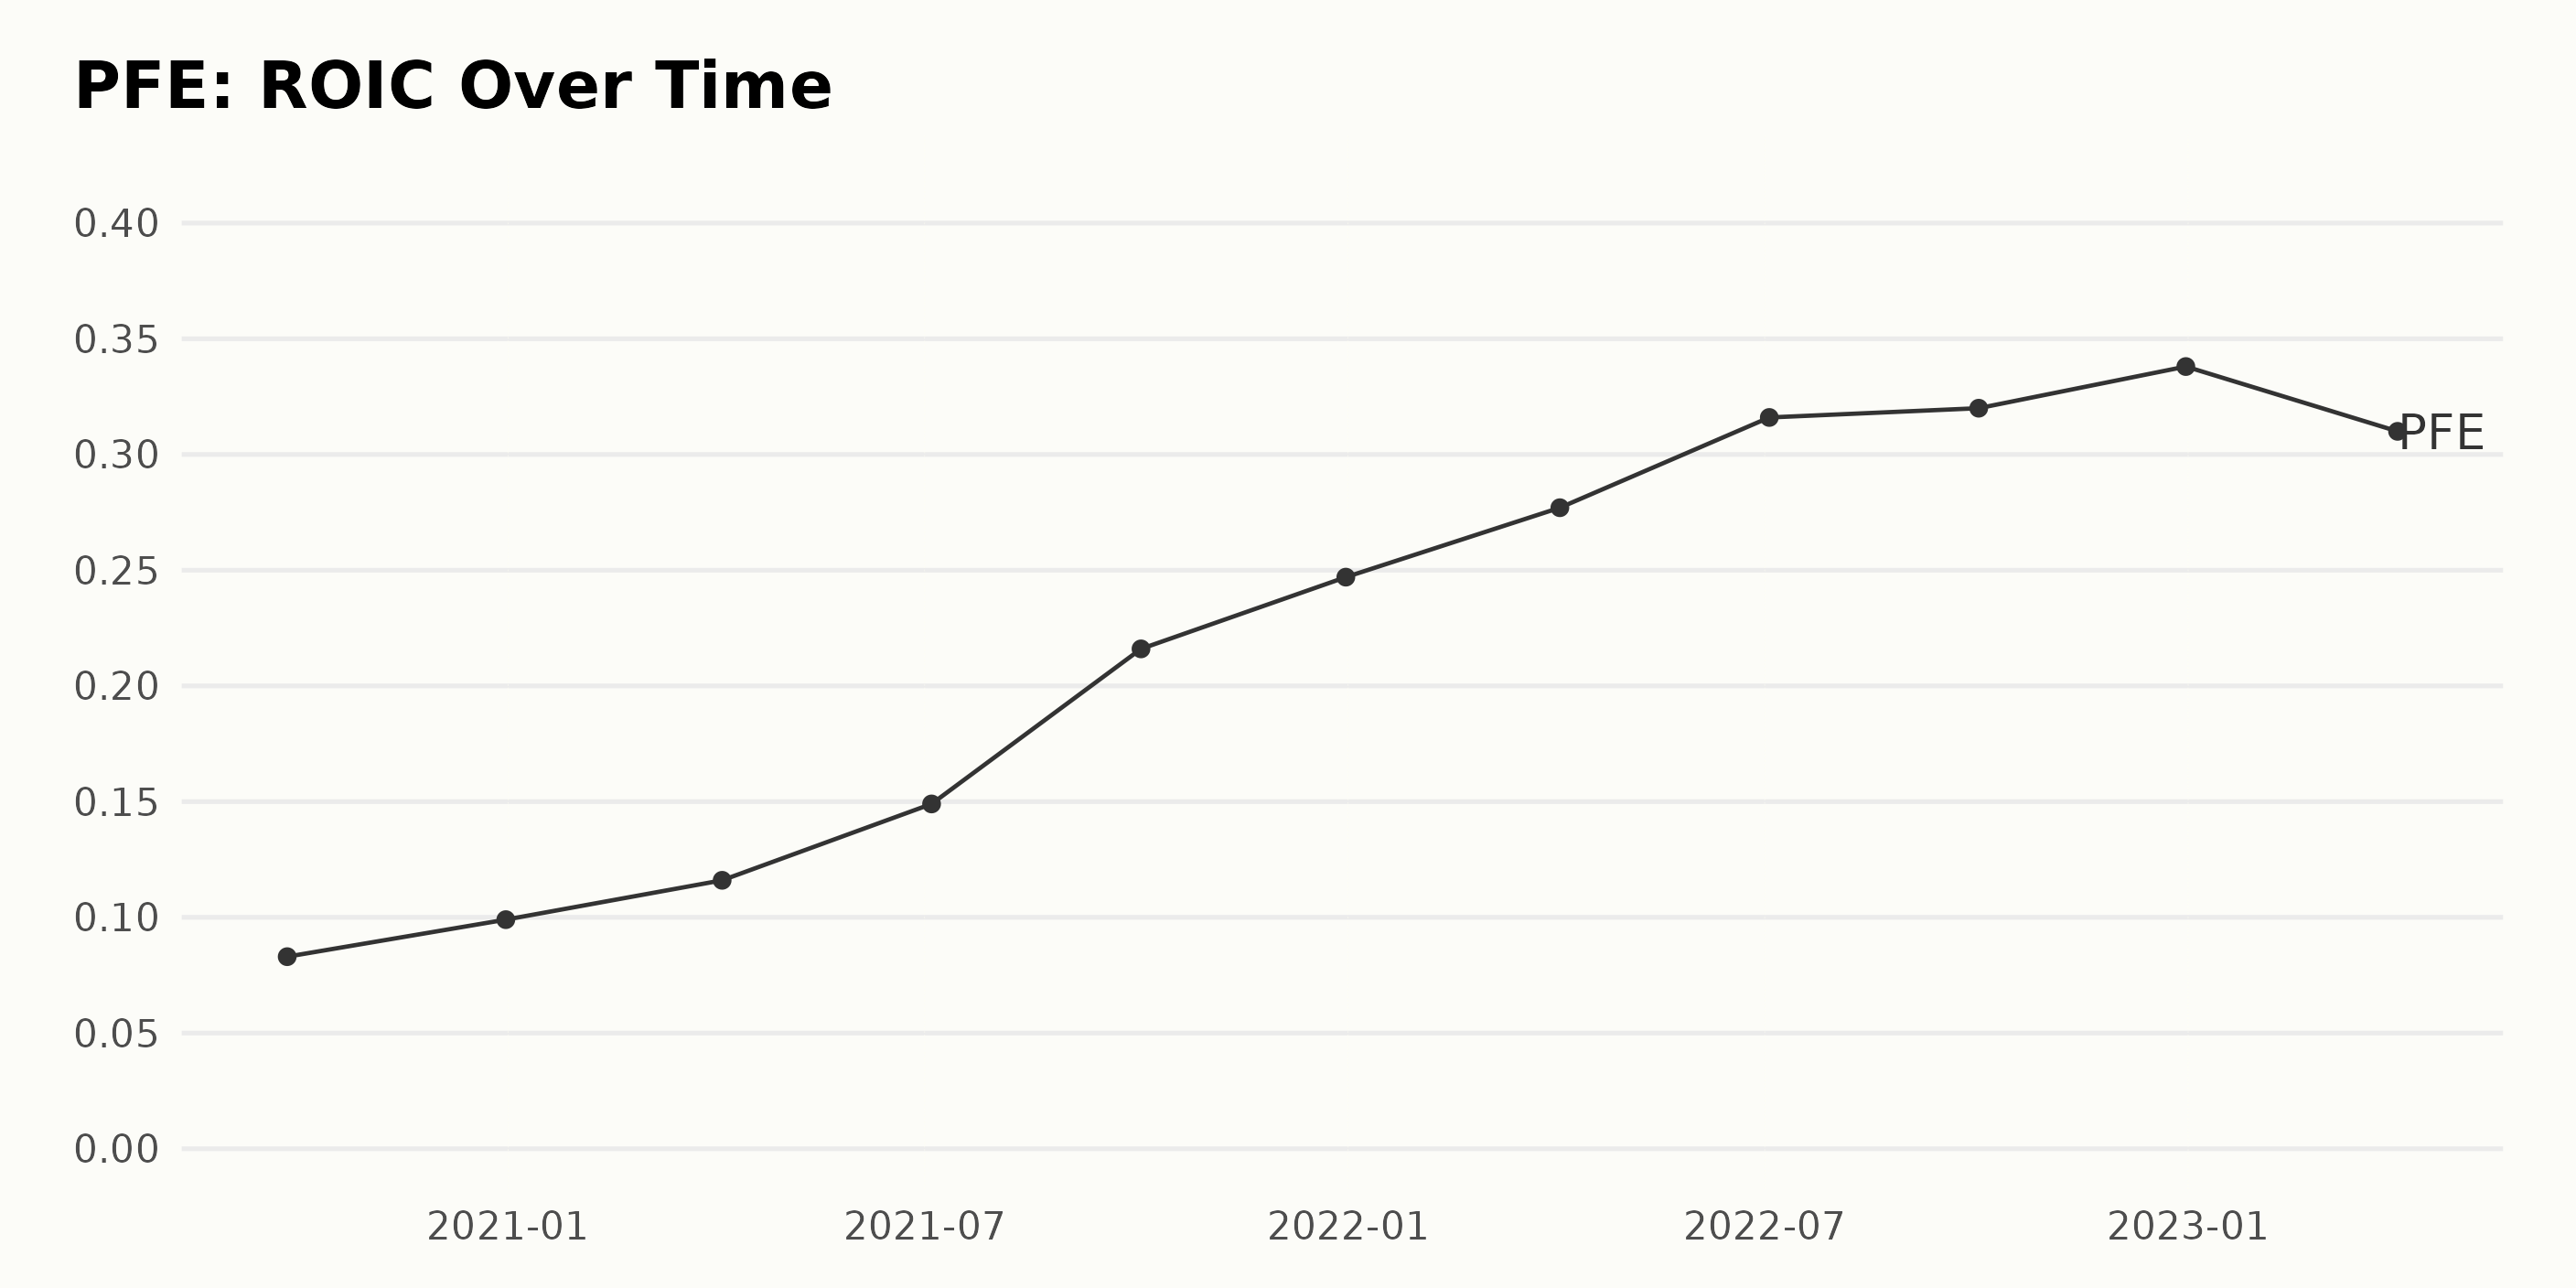
The analyzed data report on the Return On Invested Capital (ROIC) of PFE reveals several noteworthy trends and fluctuations:
- From September 2020 to April 2023, PFE’s ROIC shows a significant upward trend, with some periods of faster growth.
- In detail, a gentle increase was observed from September 2020 (ROIC at 8.3%) to the end of December 2020 (ROIC at 9.9%).
- A more pronounced growth phase started at the beginning of 2021. By the end of the year, the ROIC had risen steadily to reach 24.7%.
- The upward trend continued into 2022, peaking at 33.8% on December 31, 2022.
- Contrarily, a downturn was recorded in the first quarter of 2023, with the ROIC dropping to 31% as of April 2, 2023.
Based on these figures, the net growth rate of the company's ROIC from September 2020 to April 2023 is approximately 273%. However, it is important to note the sudden downward trend in the most recent quarter in 2023, which calls for close monitoring of future development. Nonetheless, the general increase over the past few years reflects positively on PFE’s investment efficiency.
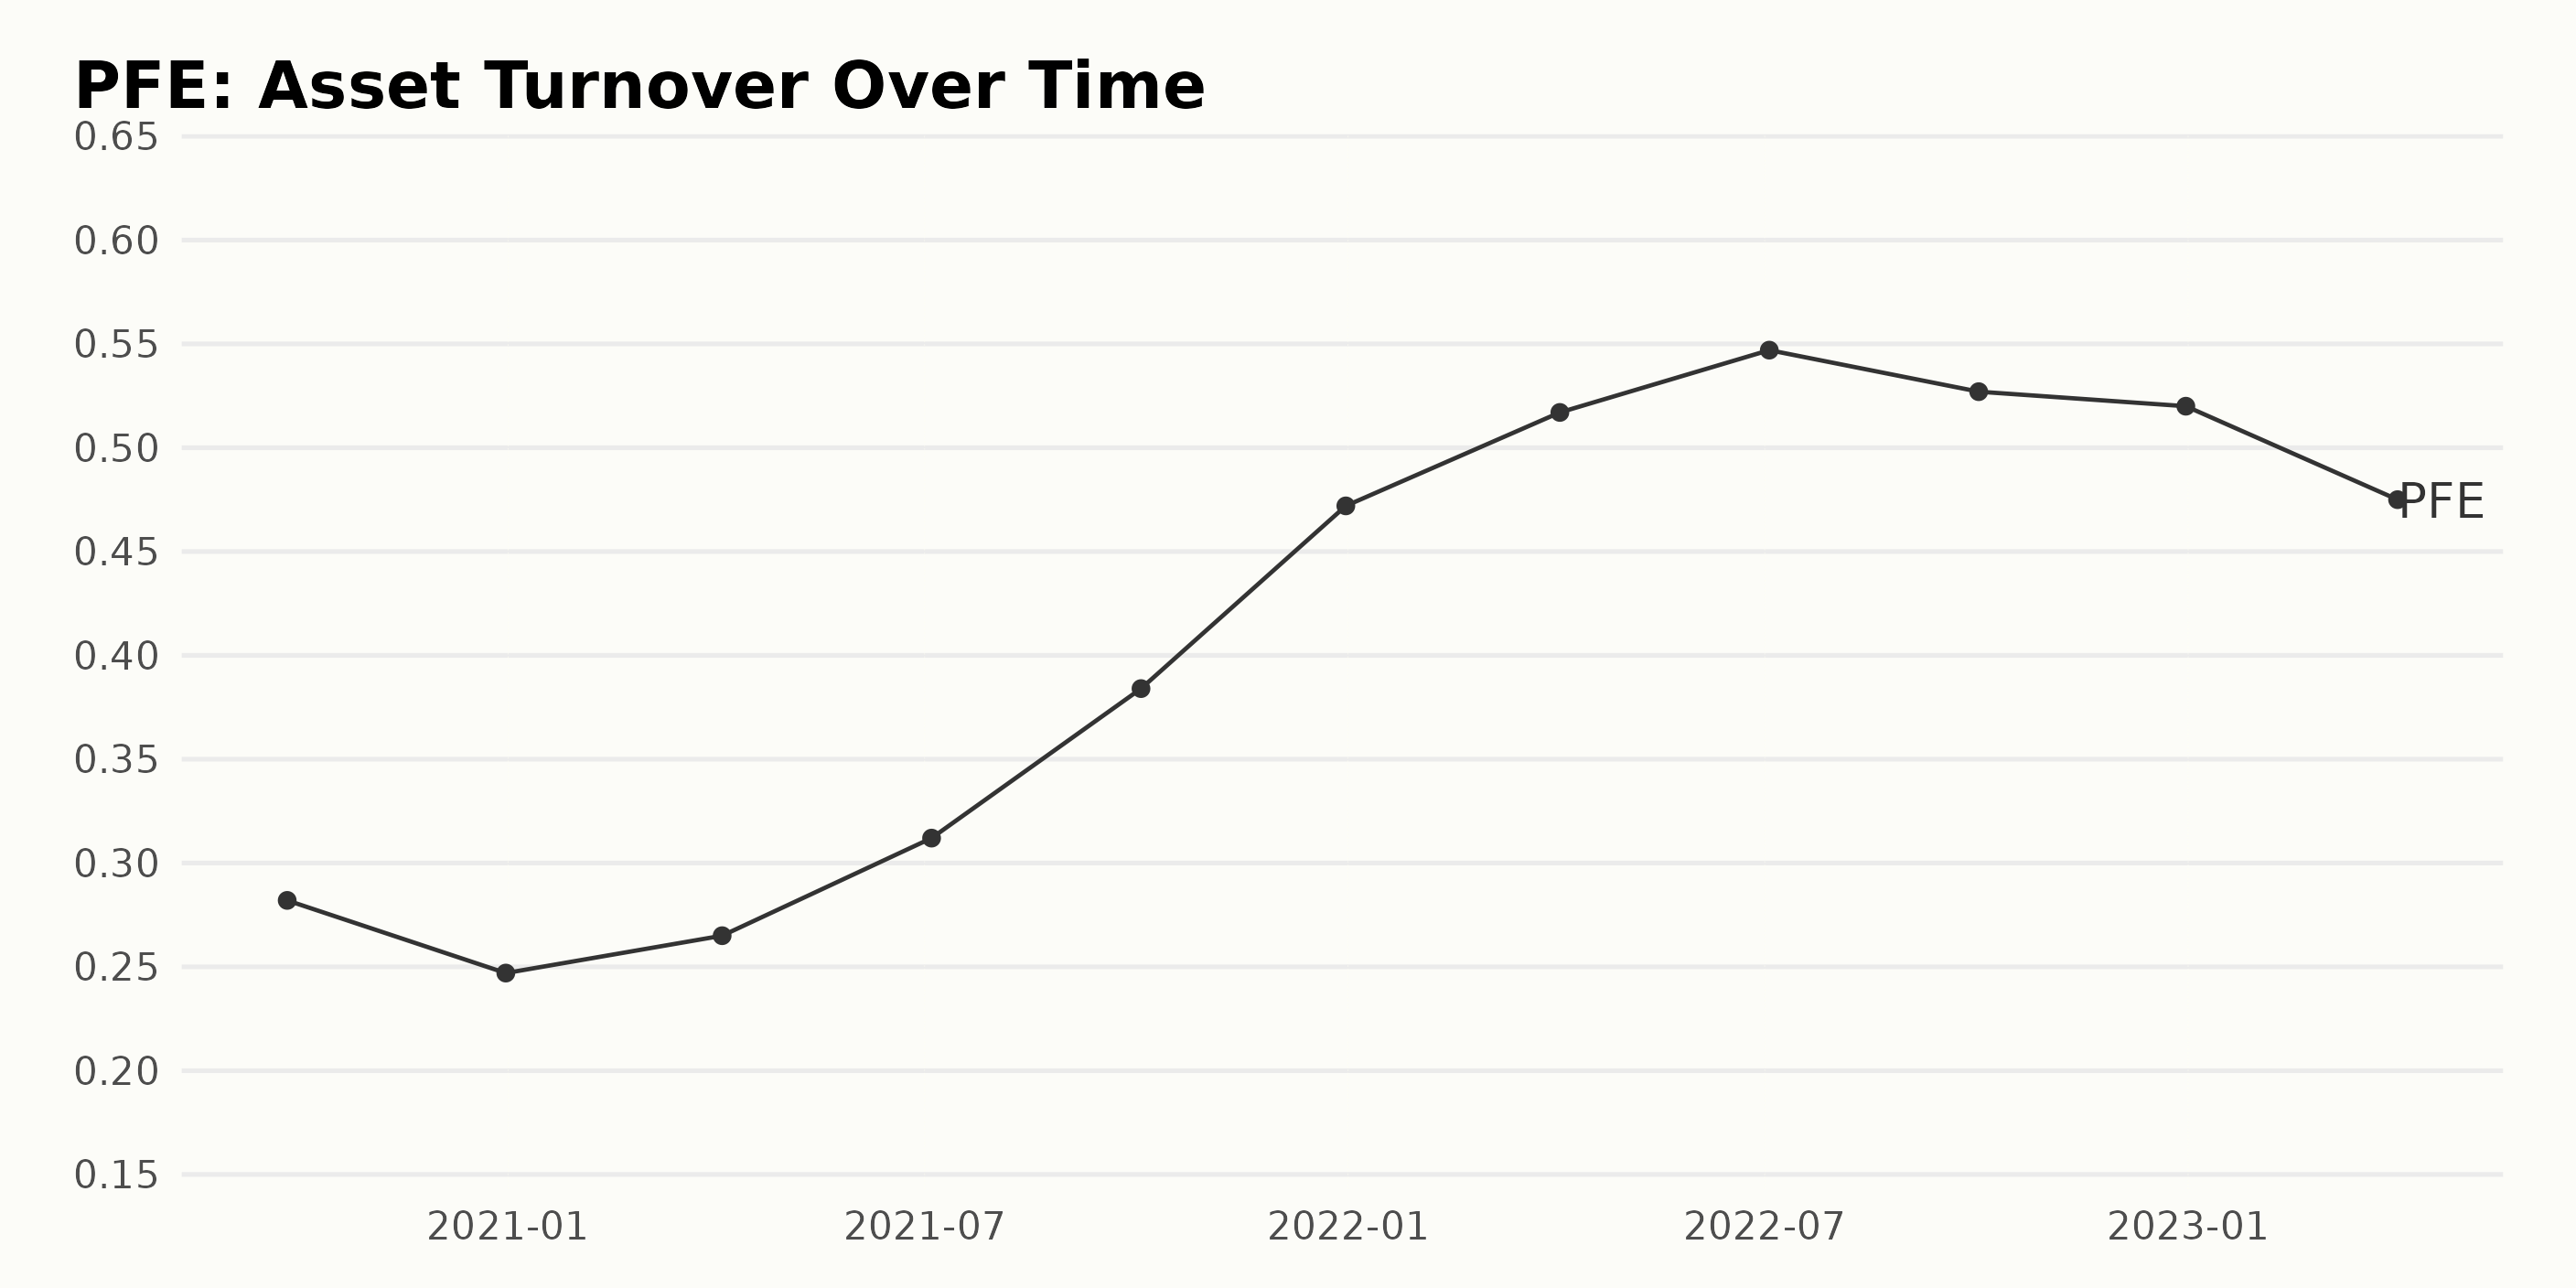
The asset turnover for PFE shows a general upward trend with fluctuations from September 2020 to April 2023. The details are as follows:
- On September 27, 2020, the asset turnover stood at 0.28.
- By December 31, 2020, it had dropped slightly to 0.25.
- The asset turnover climbed back to 0.31 by July 4, 2021.
- It continued to increase to a peak of 0.55 by July 3, 2022.
- However, there was a decrease to 0.53 by October 2, 2022, and a slight drop to 0.52 by the end of 2022.
- As of April 2, 2023, the latest data point shows a decrease to 0.47.
If we calculate growth in terms of the difference between the first and last values, PFE’s asset turnover has increased by approximately 69% from September 2020 to April 2023. These figures suggest a notable rising trend, generally indicating good asset efficiency, but the more recent drops signal potential areas to investigate further.
Analyzing Pfizer Inc's Stock Price Trend: A Downward Journey from February to August 2023
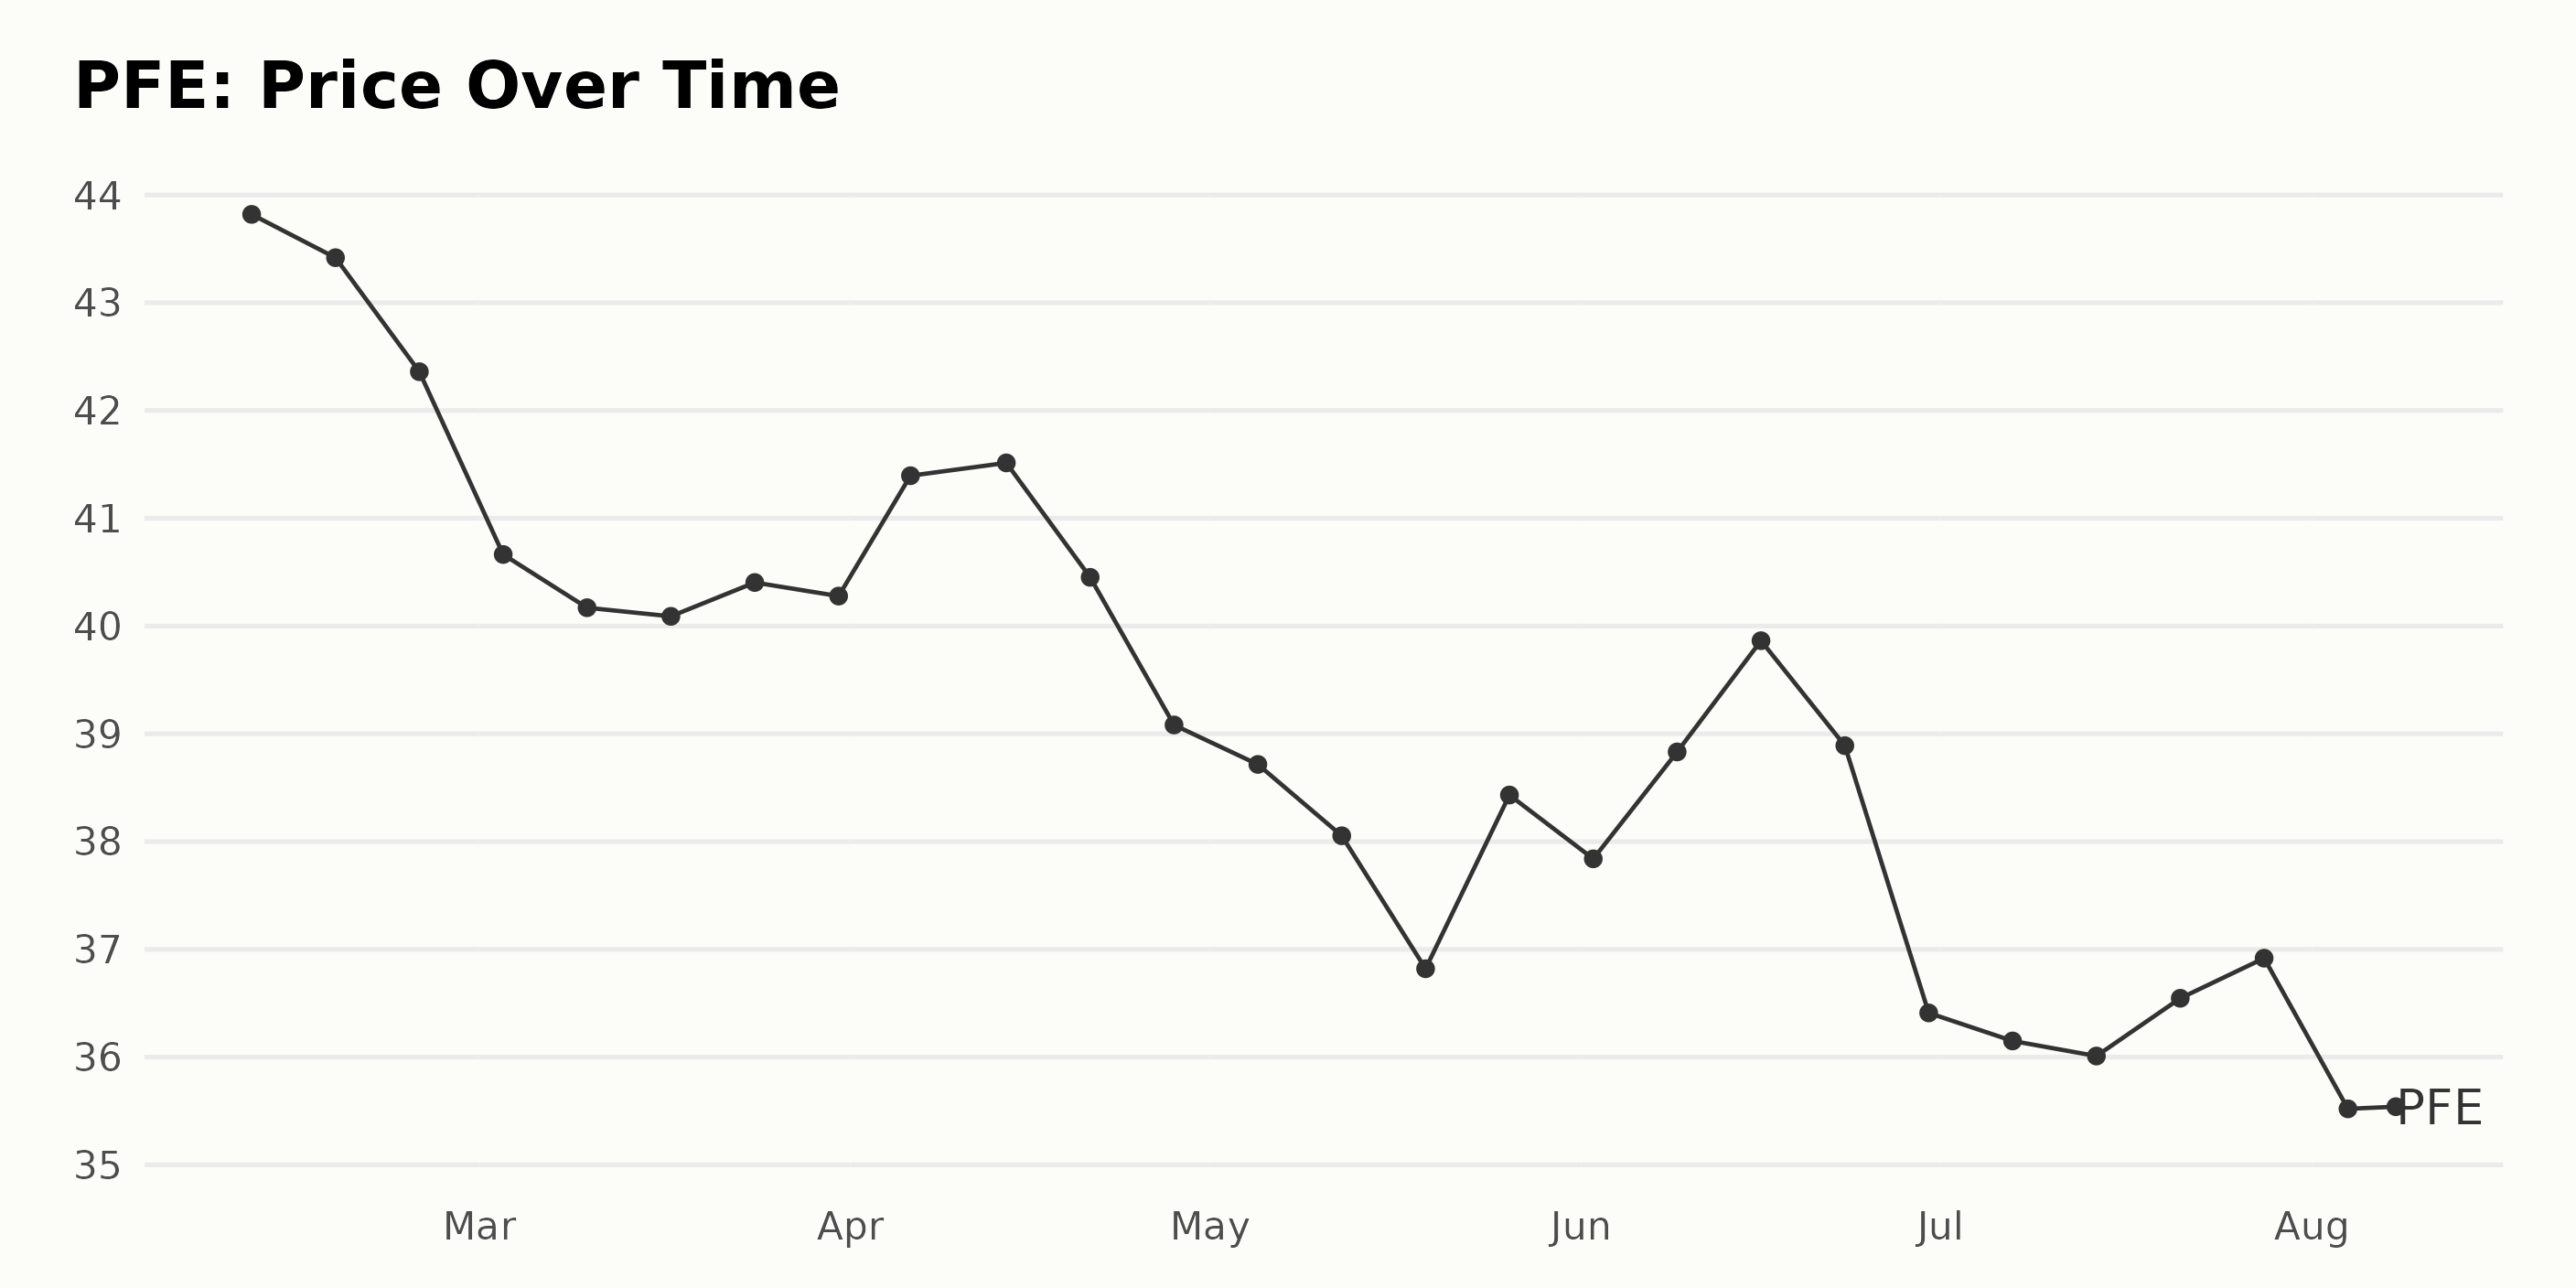
Upon looking at the price development of PFE from February 10, 2023, to August 8, 2023, we can observe a general downward trend with some temporary reversals:
- The share started at $43.82 on February 10, 2023, and experienced a gentle drop towards $40.40 by March 24, 2023, rendering an average weekly decline.
- A minor upward trend was noticed when it increased to $41.51 by April 14, 2023.
- This increase was then followed by a pronounced decrease to $36.82 on May 19, 2023, after which the price seemed to stabilize and slightly rose to $38.83 on June 9, 2023.
- A peak was reached on June 16, 2023, at $39.86. However, the prices continued to fall over the following weeks, reaching $35.52 on August 4, 2023, the lowest value in the observed period.
- On the final recorded date of August 8, 2023, there was a minute increase again to $35.64.
In summation, the general trend for PFE’s stock price from February 10, 2023, to August 8, 2023, shows a decrease. While there were short periods of increase, these do not negate the widespread downward momentum at this time.
It seems to suggest a decelerating rate in its market valuation within this time window. Decisions on stock investments should consider this alongside other market indicators and projections. Here is a chart of PFE's price over the past 180 days.
PFE’s POWR Ratings: Examining Value, Quality, and Stability Dimensions"
The latest POWR Ratings grade for PFE, as of August 2023, is C (Neutral). The company's rank within its category, Medical - Pharmaceuticals, which contains a total of 165 stocks, is #45. Here's a more detailed overview of PFE's performance over the recent months:
- On February 11, 2023, PFE had a POWR grade of B (Buy) with a rank of #26 in its category.
- The POWR grade remained B (Buy) through April 29, 2023, while the company's rank fluctuated modestly between #26 and #31.
- From May 6, 2023, to June 24, 2023, the POWR grade stayed at B (Buy), but the rank worsened, increasing from #31 to #40.
- A notable change occurred on July 8, 2023, when the POWR grade fell from B (Buy) to C (Neutral). The rank during this month varied between #40 and #44.
- Throughout August 2023, the POWR grade continued to be C (Neutral), with the rank slightly worsening to #45 by August 8.
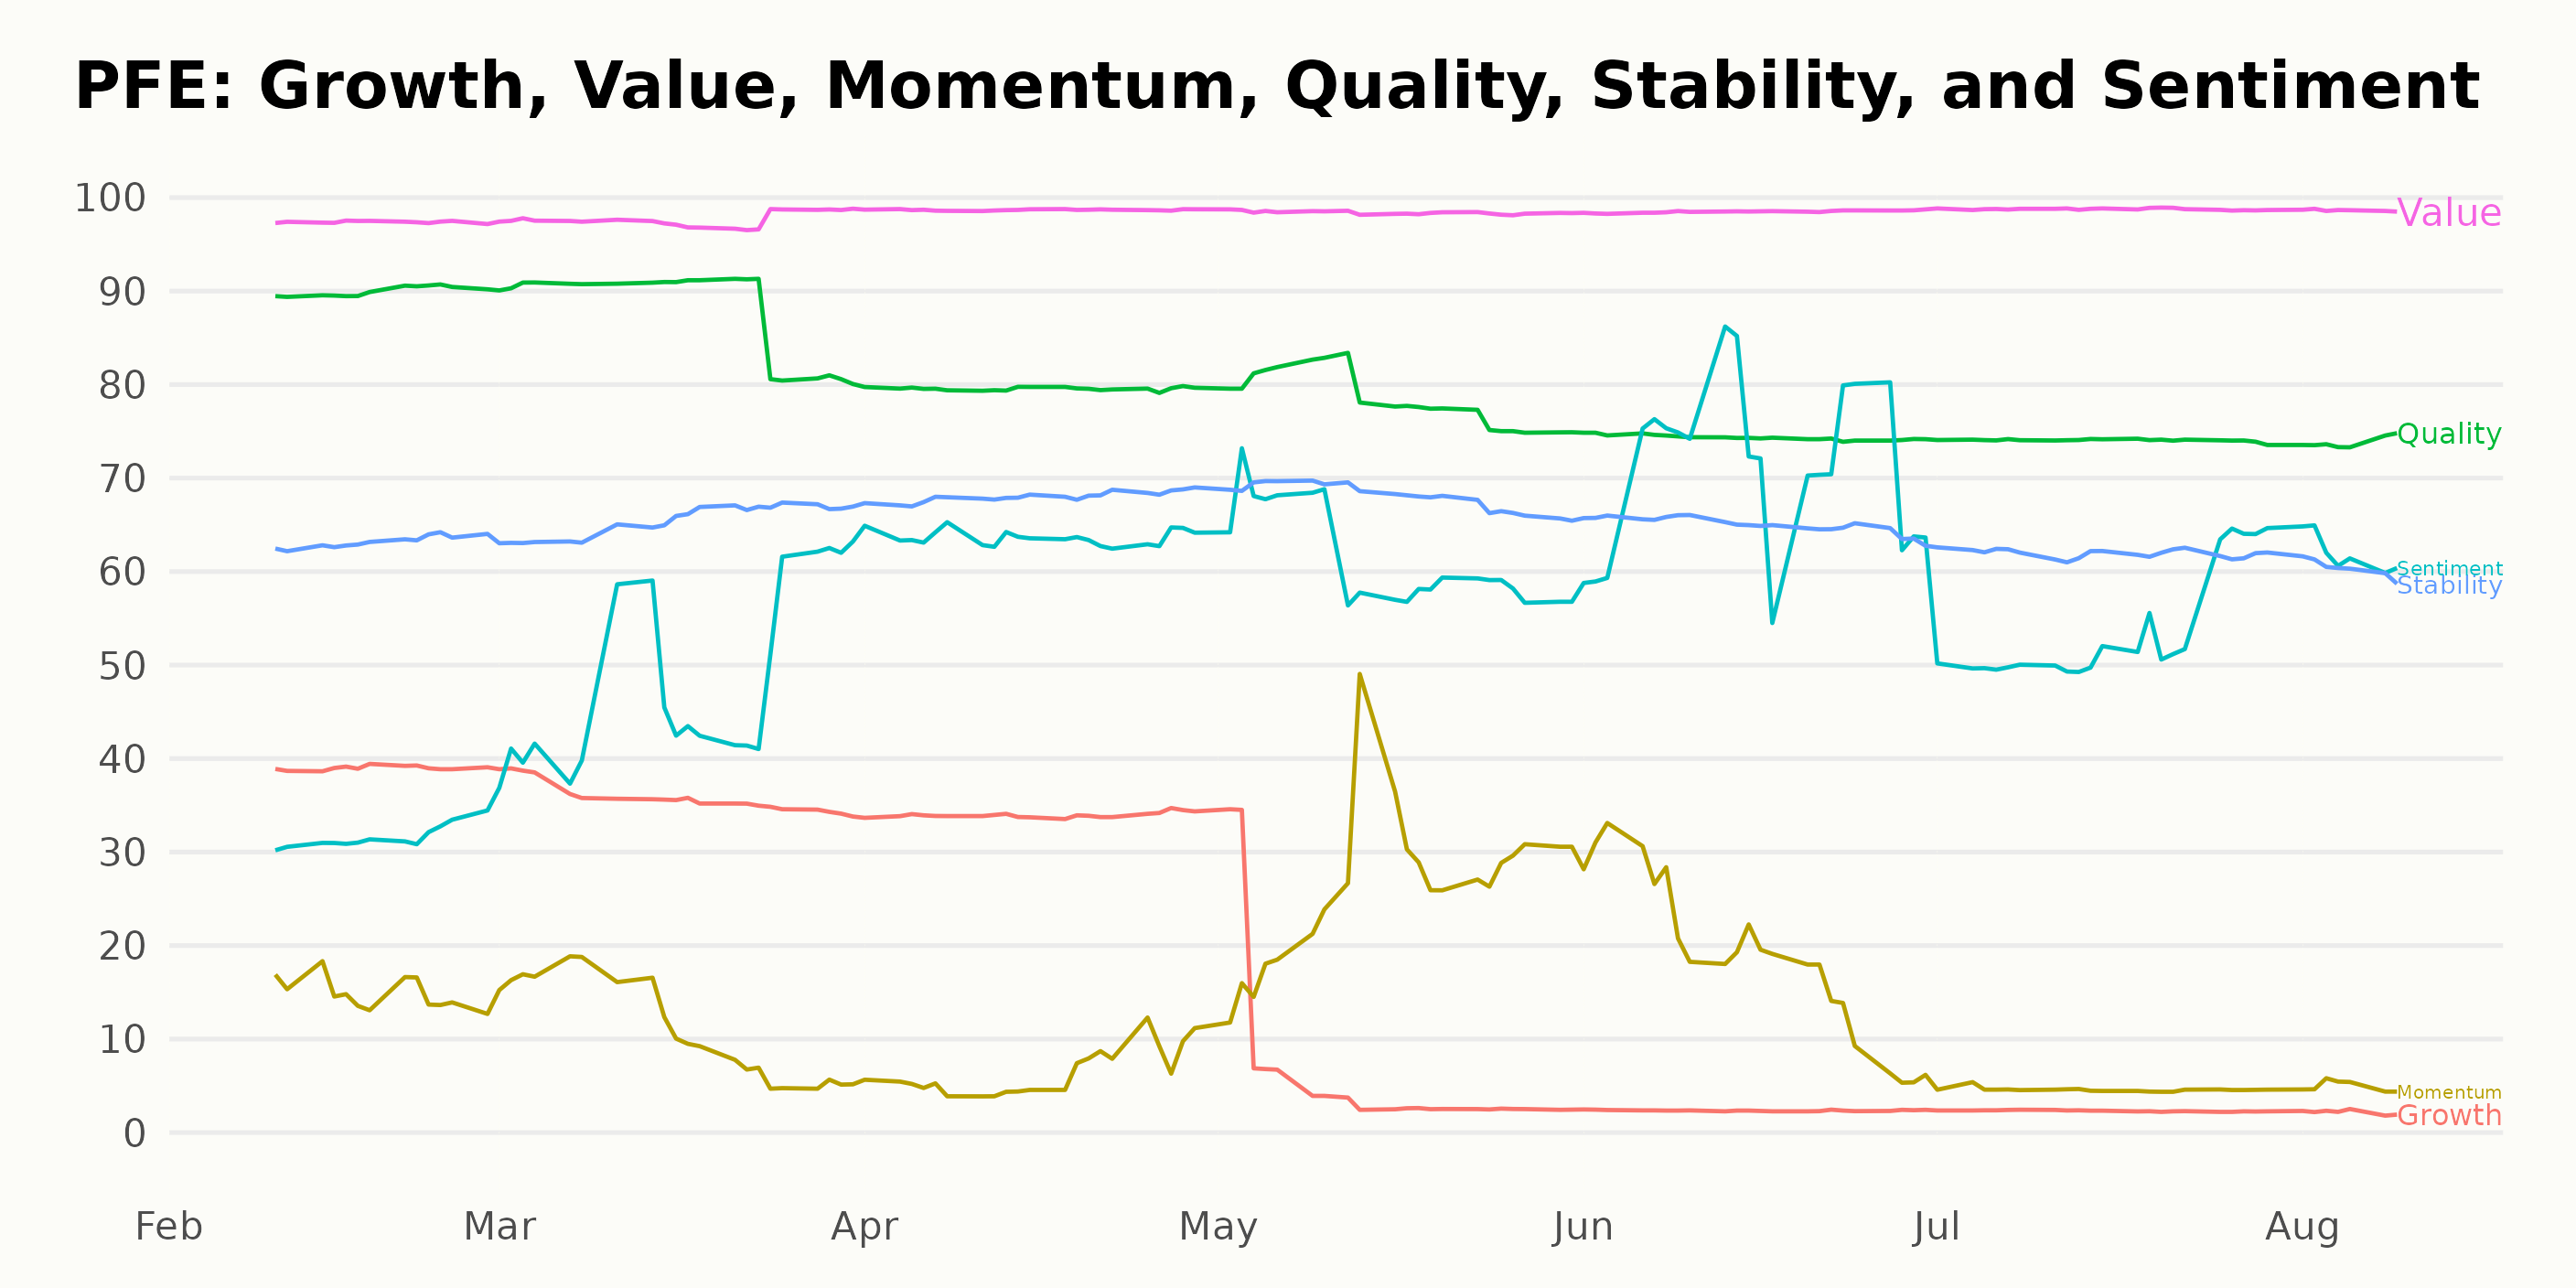
Analyzing the POWR Ratings of PFE across six dimensions, it's clear that the three most noteworthy dimensions are Value, Quality, and Stability.
Value: PFE consistently achieves high ratings in this dimension, showing a trend toward continuous improvement. The ratings rose incrementally from 97 in February 2023 to a high of 99 in months spanning from April 2023 to August 2023. This result indicates that PFE represents a strong value proposition concerning its price and intrinsic worth.
Quality: With appreciable ratings throughout the given period, starting from 90 in February 2023, a slight dip is witnessed, reaching 74 by June 2023 and staying consistent thereafter till August 2023. Despite slight fluctuations, the persistent high ratings illustrate PFE’s capacity to consistently provide quality performance.
Stability: For PFE, Stability exhibited a modest rise from the initial rating of 63 in February 2023, hitting its peak at 68 in the period April-May 2023, but displayed a sliding trend afterward, going down to 61 in August 2023. Nonetheless, PFE generally demonstrates moderate stability, as indicated through most of the recorded periods.
These three dimensions affirm an overall positive outlook for PFE, especially in terms of Value and Quality, along with a fairly stable trend with slight fluctuations.
How does Pfizer Inc. (PFE) Stack Up Against its Peers?
Other stocks in the Medical - Pharmaceuticals sector that may be worth considering are Novo Nordisk A/S (NVO), Novartis AG (NVS), and Santen Pharmaceutical Co., Ltd. (SNPHY) - they have better POWR Ratings.
What To Do Next?
Get your hands on this special report with 3 low priced companies with tremendous upside potential even in today’s volatile markets:
3 Stocks to DOUBLE This Year >
PFE shares were trading at $35.95 per share on Wednesday afternoon, up $0.31 (+0.87%). Year-to-date, PFE has declined -27.63%, versus a 17.58% rise in the benchmark S&P 500 index during the same period.
About the Author: Aanchal Sugandh

Aanchal's passion for financial markets drives her work as an investment analyst and journalist. She earned her bachelor's degree in finance and is pursuing the CFA program. She is proficient at assessing the long-term prospects of stocks with her fundamental analysis skills. Her goal is to help investors build portfolios with sustainable returns.
The post Should Value Investors Go After Pfizer (PFE)? appeared first on StockNews.com