Burger restaurant chain Red Robin (NASDAQ:RRGB) reported Q3 CY2024 results beating Wall Street’s revenue expectations, but sales fell 1.1% year on year to $274.6 million. The company expects the full year’s revenue to be around $1.25 billion, close to analysts’ estimates. Its non-GAAP loss of $1.13 per share was 18% below analysts’ consensus estimates.
Is now the time to buy Red Robin? Find out by accessing our full research report, it’s free.
Red Robin (RRGB) Q3 CY2024 Highlights:
- Revenue: $274.6 million vs analyst estimates of $270.8 million (1.4% beat)
- Adjusted EPS: -$1.13 vs analyst estimates of -$0.96
- EBITDA: $2.08 million vs analyst estimates of $3.12 million (33.4% miss)
- The company reconfirmed its revenue guidance for the full year of $1.25 billion at the midpoint
- EBITDA guidance for the full year is $36.25 million at the midpoint, below analyst estimates of $41.07 million
- Gross Margin (GAAP): 10.3%, down from 12.5% in the same quarter last year
- Operating Margin: -4.7%, down from -0.7% in the same quarter last year
- EBITDA Margin: 0.8%, down from 2.4% in the same quarter last year
- Same-Store Sales were flat year on year (-3.4% in the same quarter last year)
- Market Capitalization: $95.78 million
Company Overview
Known for its bottomless steak fries, Red Robin (NASDAQ:RRGB) is a chain of casual restaurants specializing in burgers and general American fare.
Sit-Down Dining
Sit-down restaurants offer a complete dining experience with table service. These establishments span various cuisines and are renowned for their warm hospitality and welcoming ambiance, making them perfect for family gatherings, special occasions, or simply unwinding. Their extensive menus range from appetizers to indulgent desserts and wines and cocktails. This space is extremely fragmented and competition includes everything from publicly-traded companies owning multiple chains to single-location mom-and-pop restaurants.
Sales Growth
Reviewing a company’s long-term performance can reveal insights into its business quality. Any business can have short-term success, but a top-tier one sustains growth for years.
Red Robin is a mid-sized restaurant chain, which sometimes brings disadvantages compared to larger competitors benefiting from better brand awareness and economies of scale.
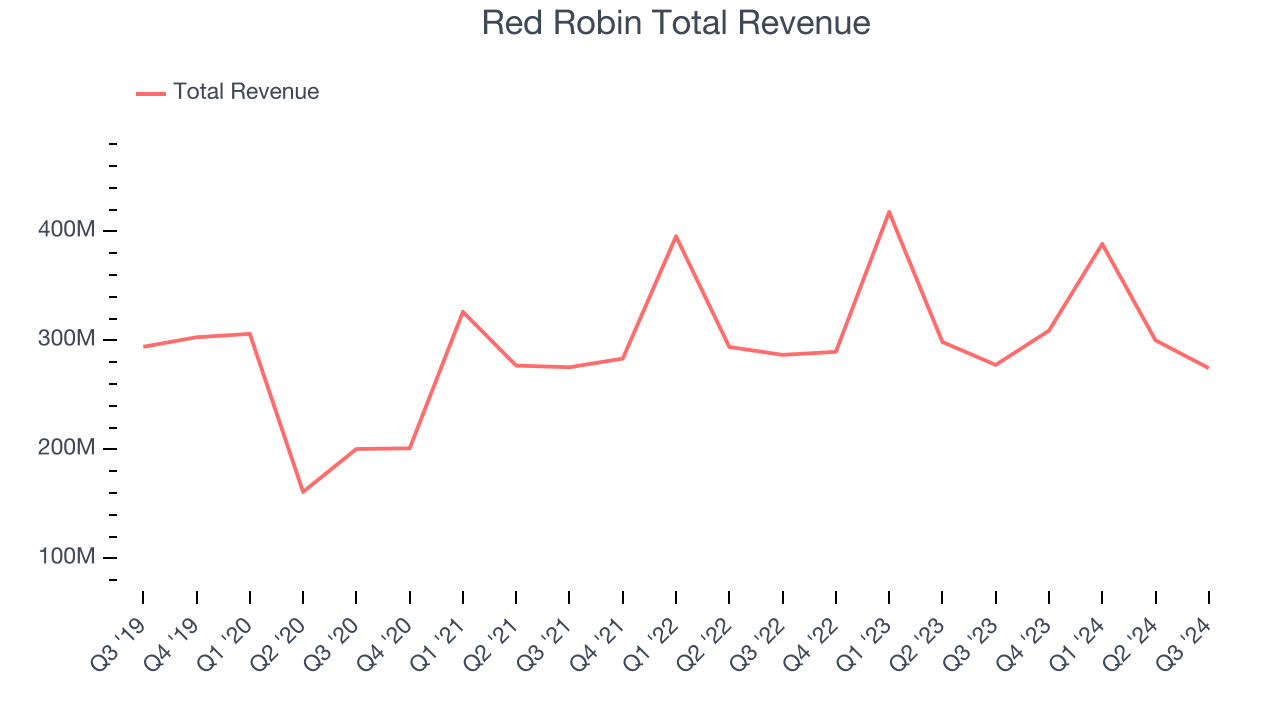
As you can see below, Red Robin struggled to generate demand over the last five years (we compare to 2019 to normalize for COVID-19 impacts). Its sales were flat because it closed restaurants.

This quarter, Red Robin’s revenue fell 1.1% year on year to $274.6 million but beat Wall Street’s estimates by 1.4%.
Looking ahead, sell-side analysts expect revenue to decline 1.1% over the next 12 months, similar to its five-year rate. This projection is underwhelming and shows the market believes its newer offerings will not catalyze better top-line performance yet.
Today’s young investors won’t have read the timeless lessons in Gorilla Game: Picking Winners In High Technology because it was written more than 20 years ago when Microsoft and Apple were first establishing their supremacy. But if we apply the same principles, then enterprise software stocks leveraging their own generative AI capabilities may well be the Gorillas of the future. So, in that spirit, we are excited to present our Special Free Report on a profitable, fast-growing enterprise software stock that is already riding the automation wave and looking to catch the generative AI next.
Restaurant Performance
Number of Restaurants
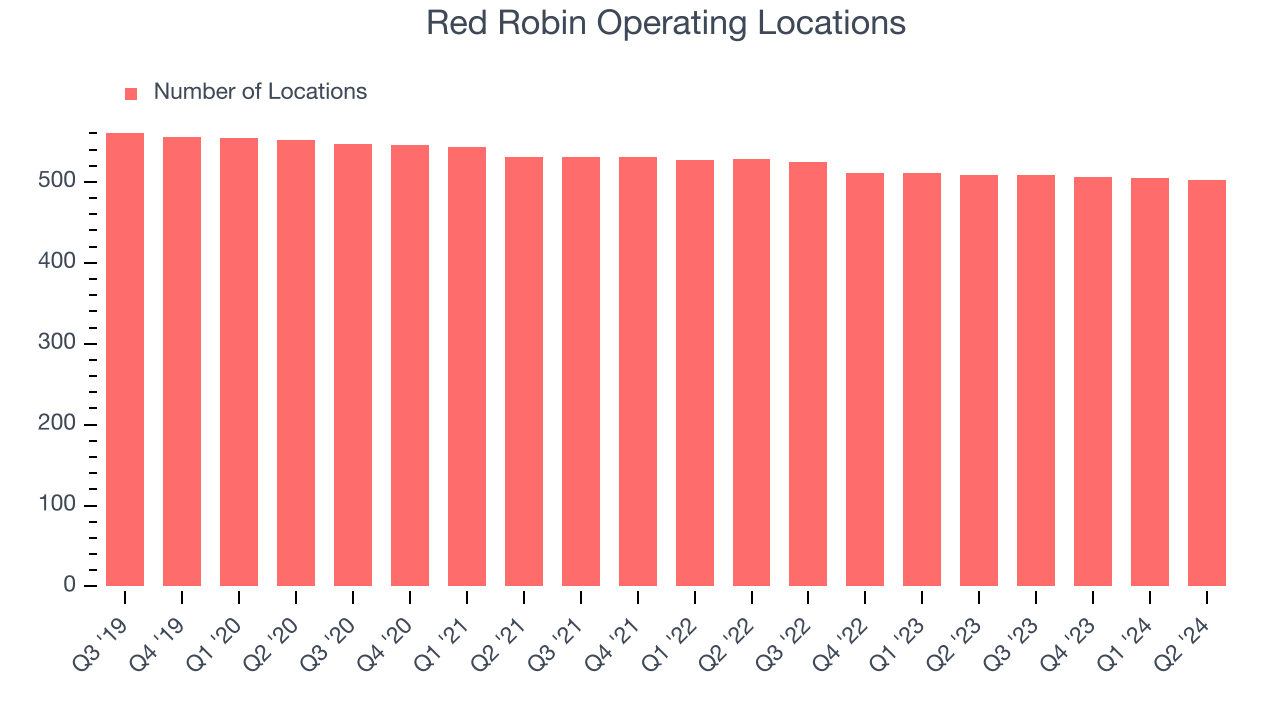
Over the last two years, Red Robin has generally closed its restaurants, averaging 2.4% annual declines.
When a chain shutters restaurants, it usually means demand for its meals is waning, and it is responding by closing underperforming locations to improve profitability.
Note that Red Robin reports its restaurant count intermittently, so some data points are missing in the chart below.

Same-Store Sales
A company's restaurant base only paints one part of the picture. When demand is high, it makes sense to open more. But when demand is low, it’s prudent to close some locations and use the money in other ways. Same-store sales gives us insight into this topic because it measures organic growth for restaurants open for at least a year.
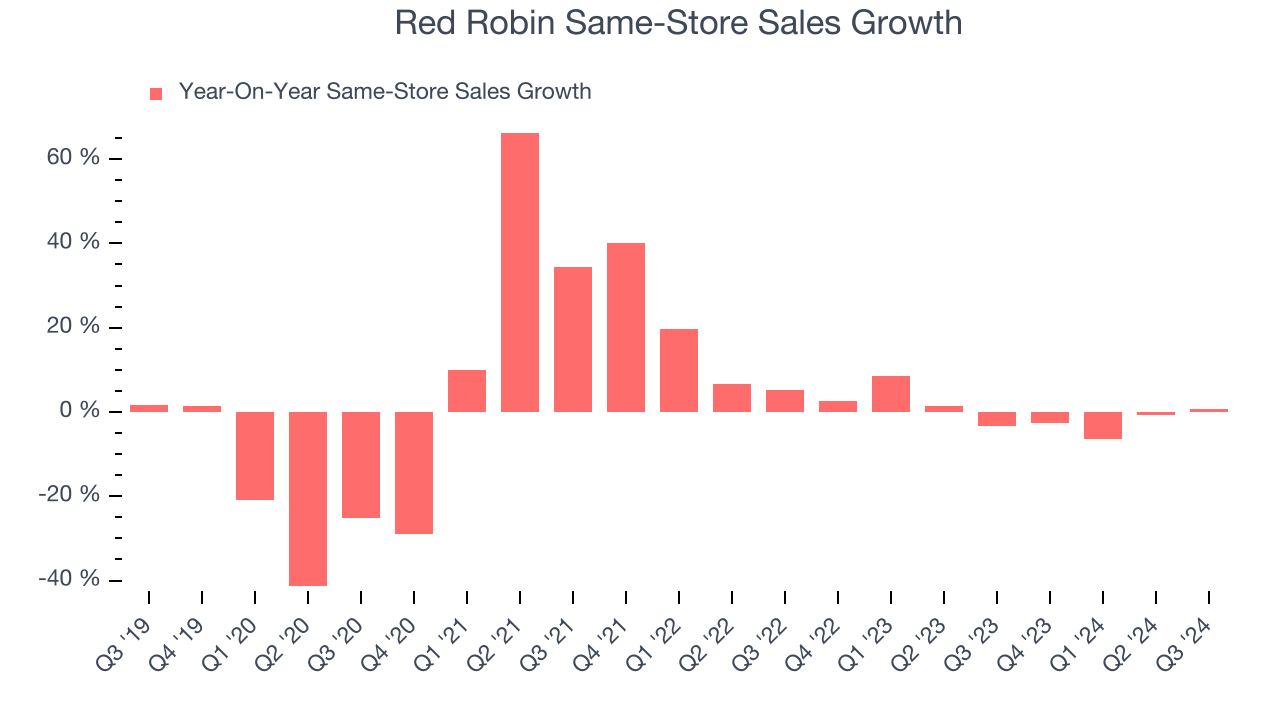
Red Robin’s demand within its existing dining locations has barely increased over the last two years as its same-store sales were flat. This performance isn’t ideal, and Red Robin is attempting to boost same-store sales by closing restaurants (fewer locations sometimes lead to higher same-store sales).

In the latest quarter, Red Robin’s year on year same-store sales were flat. This performance was a well-appreciated turnaround from the 3.4% year-on-year decline it posted 12 months ago, showing the business is doing better.
Key Takeaways from Red Robin’s Q3 Results
It was good to see Red Robin beat analysts’ revenue expectations this quarter. On the other hand, its EBITDA and EBITDA forecast for the full year missed. Overall, this was a weaker quarter. The stock traded down 3.5% to $5.92 immediately following the results.
Red Robin may have had a tough quarter, but does that actually create an opportunity to invest right now? If you’re making that decision, you should consider the bigger picture of valuation, business qualities, as well as the latest earnings. We cover that in our actionable full research report which you can read here, it’s free.


