


Rental car giant Hertz Global Holdings Inc. (NYSE: HTZ) has risen from the ashes of Chapter 11 nearly two years ago. Once an epicenter stock during the pandemic along with rival Avis Budget Group Inc. (NYSE: CAR), the company has benefitted from the travel recovery. Remember that Chapter 11 is a reorganization, so it’s Hertz, Dollar and Thrifty rental services have been operating continuously through the bankruptcy and the reorganization. The strength in travel demand has been echoed by airlines like United Airlines Holdings Inc.(NYSE: UAL) and lodging platforms like Airbnb Inc. (NASDAQ: ABNB) and Expedia Group Inc. (NASDAQ: EXPE).
Emerging from Bankruptcy
The company never closed its doors throughout its bankruptcy. It did emerge from Chapter 11 in a stronger financial position as the travel recovery momentum helped drive strong results. Travel remains at only 60% of its pre-pandemic business.The company has been growing its electric vehicle (EV) rental fleet thanks to a Tesla Co. (NASDAQ: TSLA) partnership for EVs. It also has a deal with Uber Technologies Inc. (NASDAQ: UBER) to rent Tesla EVs to Uber Drivers at a weekly rate.
Strategic Initiatives
The company continues growing its EV fleet across multiple brands and models and expanding offerings across multiple channels. It seeks to expand its Uber EV partnership program to Europe. It plans to revitalize Dollar and Thrifty brands. Hertz plans to upgrade its digital booking experience on the web and mobile app. Its also been increasing it growing its disposition of used cars through retail channels and Carvana Co. (NASDAQ: CVNA)
Rebound
On April 27, 2023, Hertz released its first-quarter 2023 results for the quarter ending March 2023. The Company reported an adjusted earnings-per-share (EPS) profit of $0.39, excluding non-recurring items, versus consensus analyst estimates for $0.21, an $0.18 beat. GAAP net income was $196 million or $0.61 per diluted share. Revenues rose 13.1% year-over-year (YOY) to $2.05 billion, beating analyst estimates of $2.03 billion.
Operating cash flow was $562 million, and adjusted operating cash flow was $104 million. The company bought back 5.7 million shares of common stock for $100 million in the quarter. Hertz ended the quarter with $2.2 billion in liquidity and $728 million in unrestricted cash. Monthly unit revenue rose 7% YoY to $1,409 due to a 208 bps benefit from utilization and pricing strength. The company still has $1 billion remaining on its share buyback authorization.
CEO Insights
Hertz CEO Stephen Scherr commented on the strength in the travel recovery helping its business, “Airlines and hotels are both forecasting robust demand and have reported strength in advanced summer bookings in their earnings calls. For Hertz, there is a particular opportunity around international inbound travel, which has been a significant component of rental revenue, yet remains only 60% back to pre-pandemic levels through Q1. Recall that this customer segment traditionally demonstrates higher margin on elevated RPD.” He noted that 10% or 50,000 of its rental car fleet are EVs. They’ve begun taking delivery of General Motors Co. (NYSE: GM) EVs. The company forecasts nearly two million EV rentals in 2023, 5X from 2022.
Hertz Global financials can be found at MarketBeat.
The definitive beginner’s guide to reading stock charts can be found free on Marketbeat.
Weekly Descending Triangle
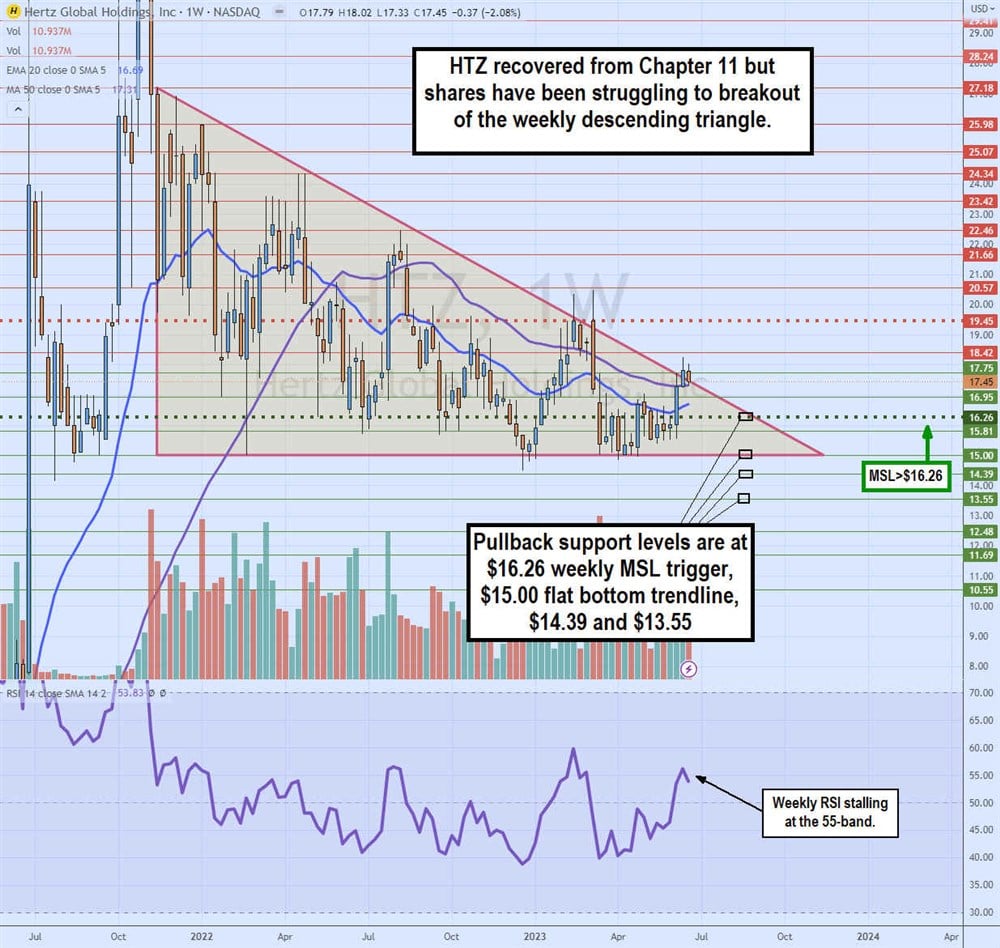
The weekly candlestick chart of HTZ started to form its descending triangle in November 2021 as shares peaked at $27.18 before selling off to the flat-bottom trendline around $15.00 in February 2022. HTZ bounces peaked at lower highs forming a descending trendline while the flat-bottom trendline remained support.
The weekly market structure low (MSL) breakout triggered through $16.26 in December 2022 for another breakout attempt through the descending trendline reaching as high as $20.57 in March 2023, but again failing and plunging to retesting the flat-bottom support at $15.00. Most recently, HTZ attempted to break out again at the $17.45 descending trendline as the weekly 20-period exponential moving average (EMA) attempts to hold support at $16.69.
HTZ shares are getting closer to the apex point where the descending trendline and flat-bottom trendline meet; at this point, a breakout or breakdown will inevitably emerge. The weekly RSI peaked and stalled at the 55-band. Pullback support levels are $16.26 weekly MSL trigger, $15.00 flat-bottom trendline, $14.39 and $13.55.
