


The stock of industrial and construction supplies wholesaler Fastenal (NASDAQ: FAST) may set up a weekly bull flag breakout. The business of selling boring but essential components like bolts, nuts, straps, screws, rivets, rings, and washers has been thriving. These are fasteners which are hardware components that attach pieces and parts together. Unlike technology stocks, there are rarely any new product cycles. Screws and bolts have been the exact standard sizes since the mid-19th century.
The company had raised prices to offset inflationary pressures but was too aggressive in raising headcounts in 2022. It experienced margin compression in Q4 2022.
Competitors
Fastenal supplies these small critical components to original equipment manufacturers (OEMs) and maintenance and repair operations (MRO), from simple repairs to homebuilding and commercial construction projects. It competes with the likes of W.W. Grainger Inc. (NYSE: GWW), Genuine Parts Co. (NYSE: GPC), and MSC Industrial Direct Co. (NYSE: MSM). The essential nature of its products makes it an industrial consumer staples stock.
The company had raised prices to mitigate the effects of inflation and rising freight costs. Fastenal achieved many milestones in the fiscal full-year 2022 centered around the $1 billion mark. E-commerce sales, international sales, and net earnings all rose by $1 billion for the first time in its history.
Steady Earnings but Slowing Growth
On Jan. 19, 2024, Fastenal released its fiscal fourth-quarter 2022 results for the quarter ending Dec. 2022. The company reported an adjusted earnings-per-share (EPS) profit of $0.43, excluding non-recurring items beating consensus analyst estimates of $0.42 by $0.01. Revenues grew by 10.7% year-over-year (YOY) to $1.7 billion, beating analyst estimates of $1.67 billion.
The company raised its quarterly dividend to $0.35, up from $0.31 per share. Its sales growth has been slowing from Q1 2022 growth of 20.3% to 18% in Q2 to 16% in Q3 and then 10.7% in Q4 2022. This caused shares to sell off on the gap initially.
Stronger Manufacturing Offset Weaker Construction Sales
Its business saw a spurt in Q4, with higher unit sales driven by strong demand in the industrial capital goods market, which offset the weakness in consumer goods and construction. Manufacturing revenues rose 16% YoY and were responsible for 73% of total sales. Raw materials costs (steel) have been moderating in the past six months but won’t be reflected in its cost of goods for several quarters. Operating margins remained stable at 19.6%. Daily e-commerce sales rose 48% YoY.
Stronger than 2019
Fastenal CEO Dan Florness commented on how Fastenal emerged as a more extensive and robust company from the pandemic: "So in the first quarter of 2022, we were 28.1% larger than we were in the first quarter of 2019. This expanded to 30% in the second quarter, expanded to about 31% in the third quarter and in the fourth quarter, we're about 35% larger than we were in the fourth quarter of 2019.”
Onsite Locations and Milestones
The company signed 62 new Onsite locations for a total of 356 Onsite locations signed in 2022. Onsite locations are dedicated customer service sites located near client facilities. It brings the total Onsite locations to 1,623 by the end of 2022, up 14% YoY. Daily sales rose in the high teens from Onsite locations.
Weekly Bull Flag Breakout
The weekly candlestick chart on FAST illustrates the year-long flag that formed since peaking at $62.78 in December 2021. Shares fell to lower lows and lower highs on bounces until reaching a bottom at $43.14 in October 2022. FAST triggered its first market structure low (MSL) at $47.15 as the weekly stochastic bounced through the 20-band, driving up shares to $52.56 before falling back to $45.44. The second MSL triggered on the 40-band weekly stochastic bounce through $49.08 in January 2023.
Shares surged through the weekly flag, falling upper trendline at $52.04, setting up for a breakout. Shares have stayed above the upper trendline bouncing up on each test.
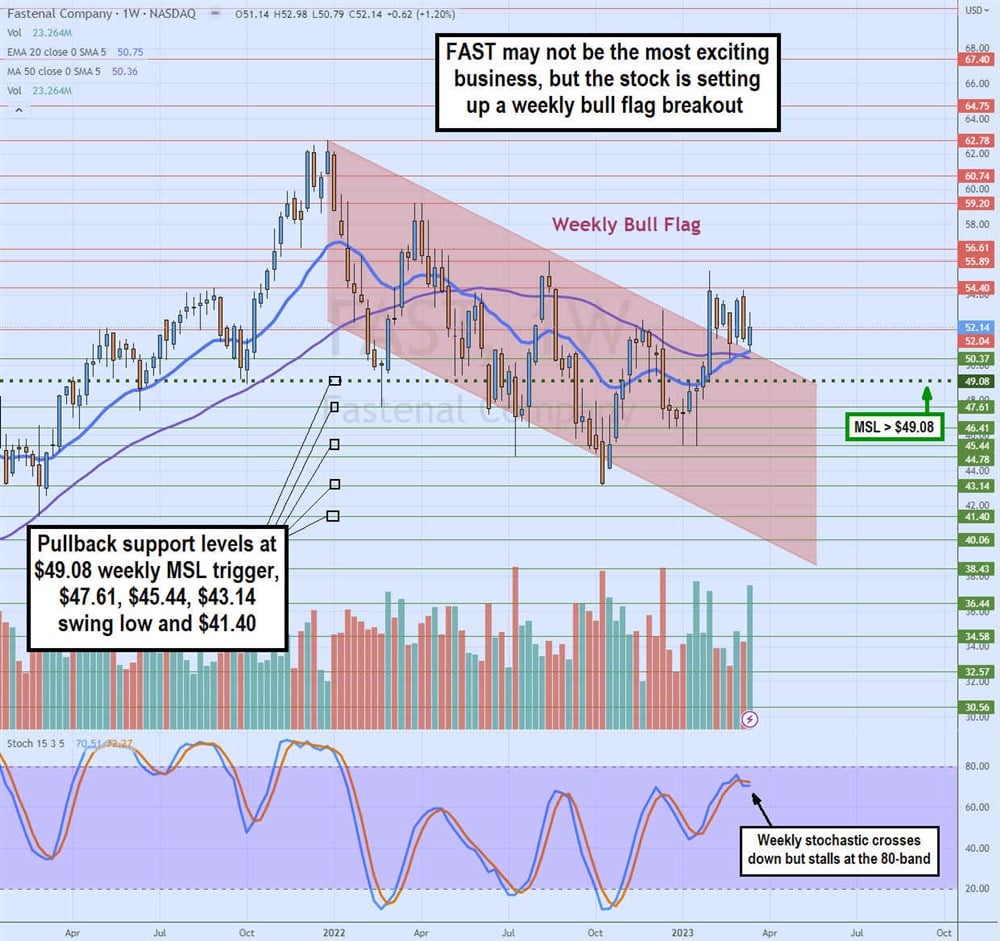
The weekly 20-period exponential moving average (EMA) has crossed through the weekly 50-period MA to become support at the upper trendline at $50.75. The weekly stochastic crossed down after failing to breakout through the 80-band. Pullback support levels are $49.08 weekly MSL trigger, $47.61, $45.44, $43.14 swing low, and $41.40.
